5 Signs of a Crypto Bull Market You Shouldn't Ignore
Spotting a crypto bull market early is basically the difference between buying near the bottom and being the poor soul who jumps in three weeks before the whole thing rolls over. Been there. It's not...

Spotting a crypto bull market early is basically the difference between buying near the bottom and being the poor soul who jumps in three weeks before the whole thing rolls over. Been there. It's not fun.
So what actually is a bull market? It's a stretch of time, usually somewhere between several months and a couple of years, where prices grind broadly upward, trading volume swells, and the general mood flips from "I'm scared to touch this" to "why isn't everyone I know buying." The trick is reading the signals that tend to show up before or during these runs: on-chain activity heating up, liquidity expanding, the media suddenly caring, altcoins catching a bid, and the big money finally showing up. Get a feel for those and you've got a framework instead of a gut feeling.
What follows are the five indicators that have historically led or ridden alongside the major crypto runs. I'm drawing on what happened in 2017, in 2020-2021, and in the more recent cycle. Whether you're a long-term holder or you're actively trading, these signals can help you act on purpose instead of reacting to every green or red candle like your life depends on it.
Table of Contents
- What Is a Crypto Bull Market and Why Timing Matters
- Sign 1: Bitcoin Breaks Key Resistance and Holds It
- Sign 2: Trading Volume and On-Chain Activity Surge
- Sign 3: Altcoin Season and Capital Rotation Begin
- Sign 4: Institutional Money and ETF Inflows Accelerate
- Sign 5: Retail Sentiment and Mainstream Media Attention Spike
- How Do These Crypto Bull Market Signs Compare Across Cycles?
- How to Position Yourself When You Spot These Signals
- Frequently Asked Questions
What Is a Crypto Bull Market and Why Timing Matters
A crypto bull market is a multi-month or multi-year phase where the total crypto market cap climbs significantly, usually alongside more adoption, better sentiment, and higher trading volumes. The keyword there is sustained. A real bull market shows repeated higher highs and higher lows across the big assets like Bitcoin and Ethereum. It's not just three random tokens mooning for a weekend while everything else bleeds.
Timing matters because crypto is brutally cyclical, and the swings are enormous. Data from CoinMarketCap shows Bitcoin dropping more than 75% from its November 2021 peak near $69,000 down to roughly $15,500 in late 2022. Then it more than quadrupled by early 2024. Just sit with that for a second. The people who read the early signs, instead of buying at the euphoric top or dumping everything at the bottom in a panic, walked away with dramatically better returns. That's the whole point. This isn't some academic exercise, it's the thing that actually decides whether your portfolio looks good or looks like a cautionary tale.
None of the five signals below is a crystal ball. But when a few of them line up at the same time, they've historically marked the early-to-middle innings of a serious upcycle.
Sign 1: Bitcoin Breaks Key Resistance and Holds It
The cleanest technical sign of a bull market is Bitcoin punching through a long-standing resistance level and then staying above it, turning that old ceiling into new support. Resistance is just a price where sellers have historically overpowered buyers. When Bitcoin blasts through it on real volume and doesn't immediately get slapped back down, that tells you buyers have grabbed the wheel.
We've seen this movie before. Bitcoin cracking its old 2017 high of around $20,000 back in December 2020 basically kicked off the whole 2020-2021 run. And when it climbed back above that $69,000 all-time high in March 2024, a level that had held for over two years, analysts everywhere took it as the "okay, the bear market is officially dead" moment. Since Bitcoin still makes up roughly 50-55% of total crypto market cap according to CoinGecko, where it goes, everything else tends to follow. Altcoins included.
But price alone isn't enough. I want to see the breakout happen on above-average daily volume, not some thin, sleepy weekend where a couple of orders can push things around. I want the 50-day moving average crossing above the 200-day (the classic "golden cross" that trend traders obsess over). And crucially, I want that old resistance to get retested and hold as support within a week or four, rather than getting rejected on the first attempt.
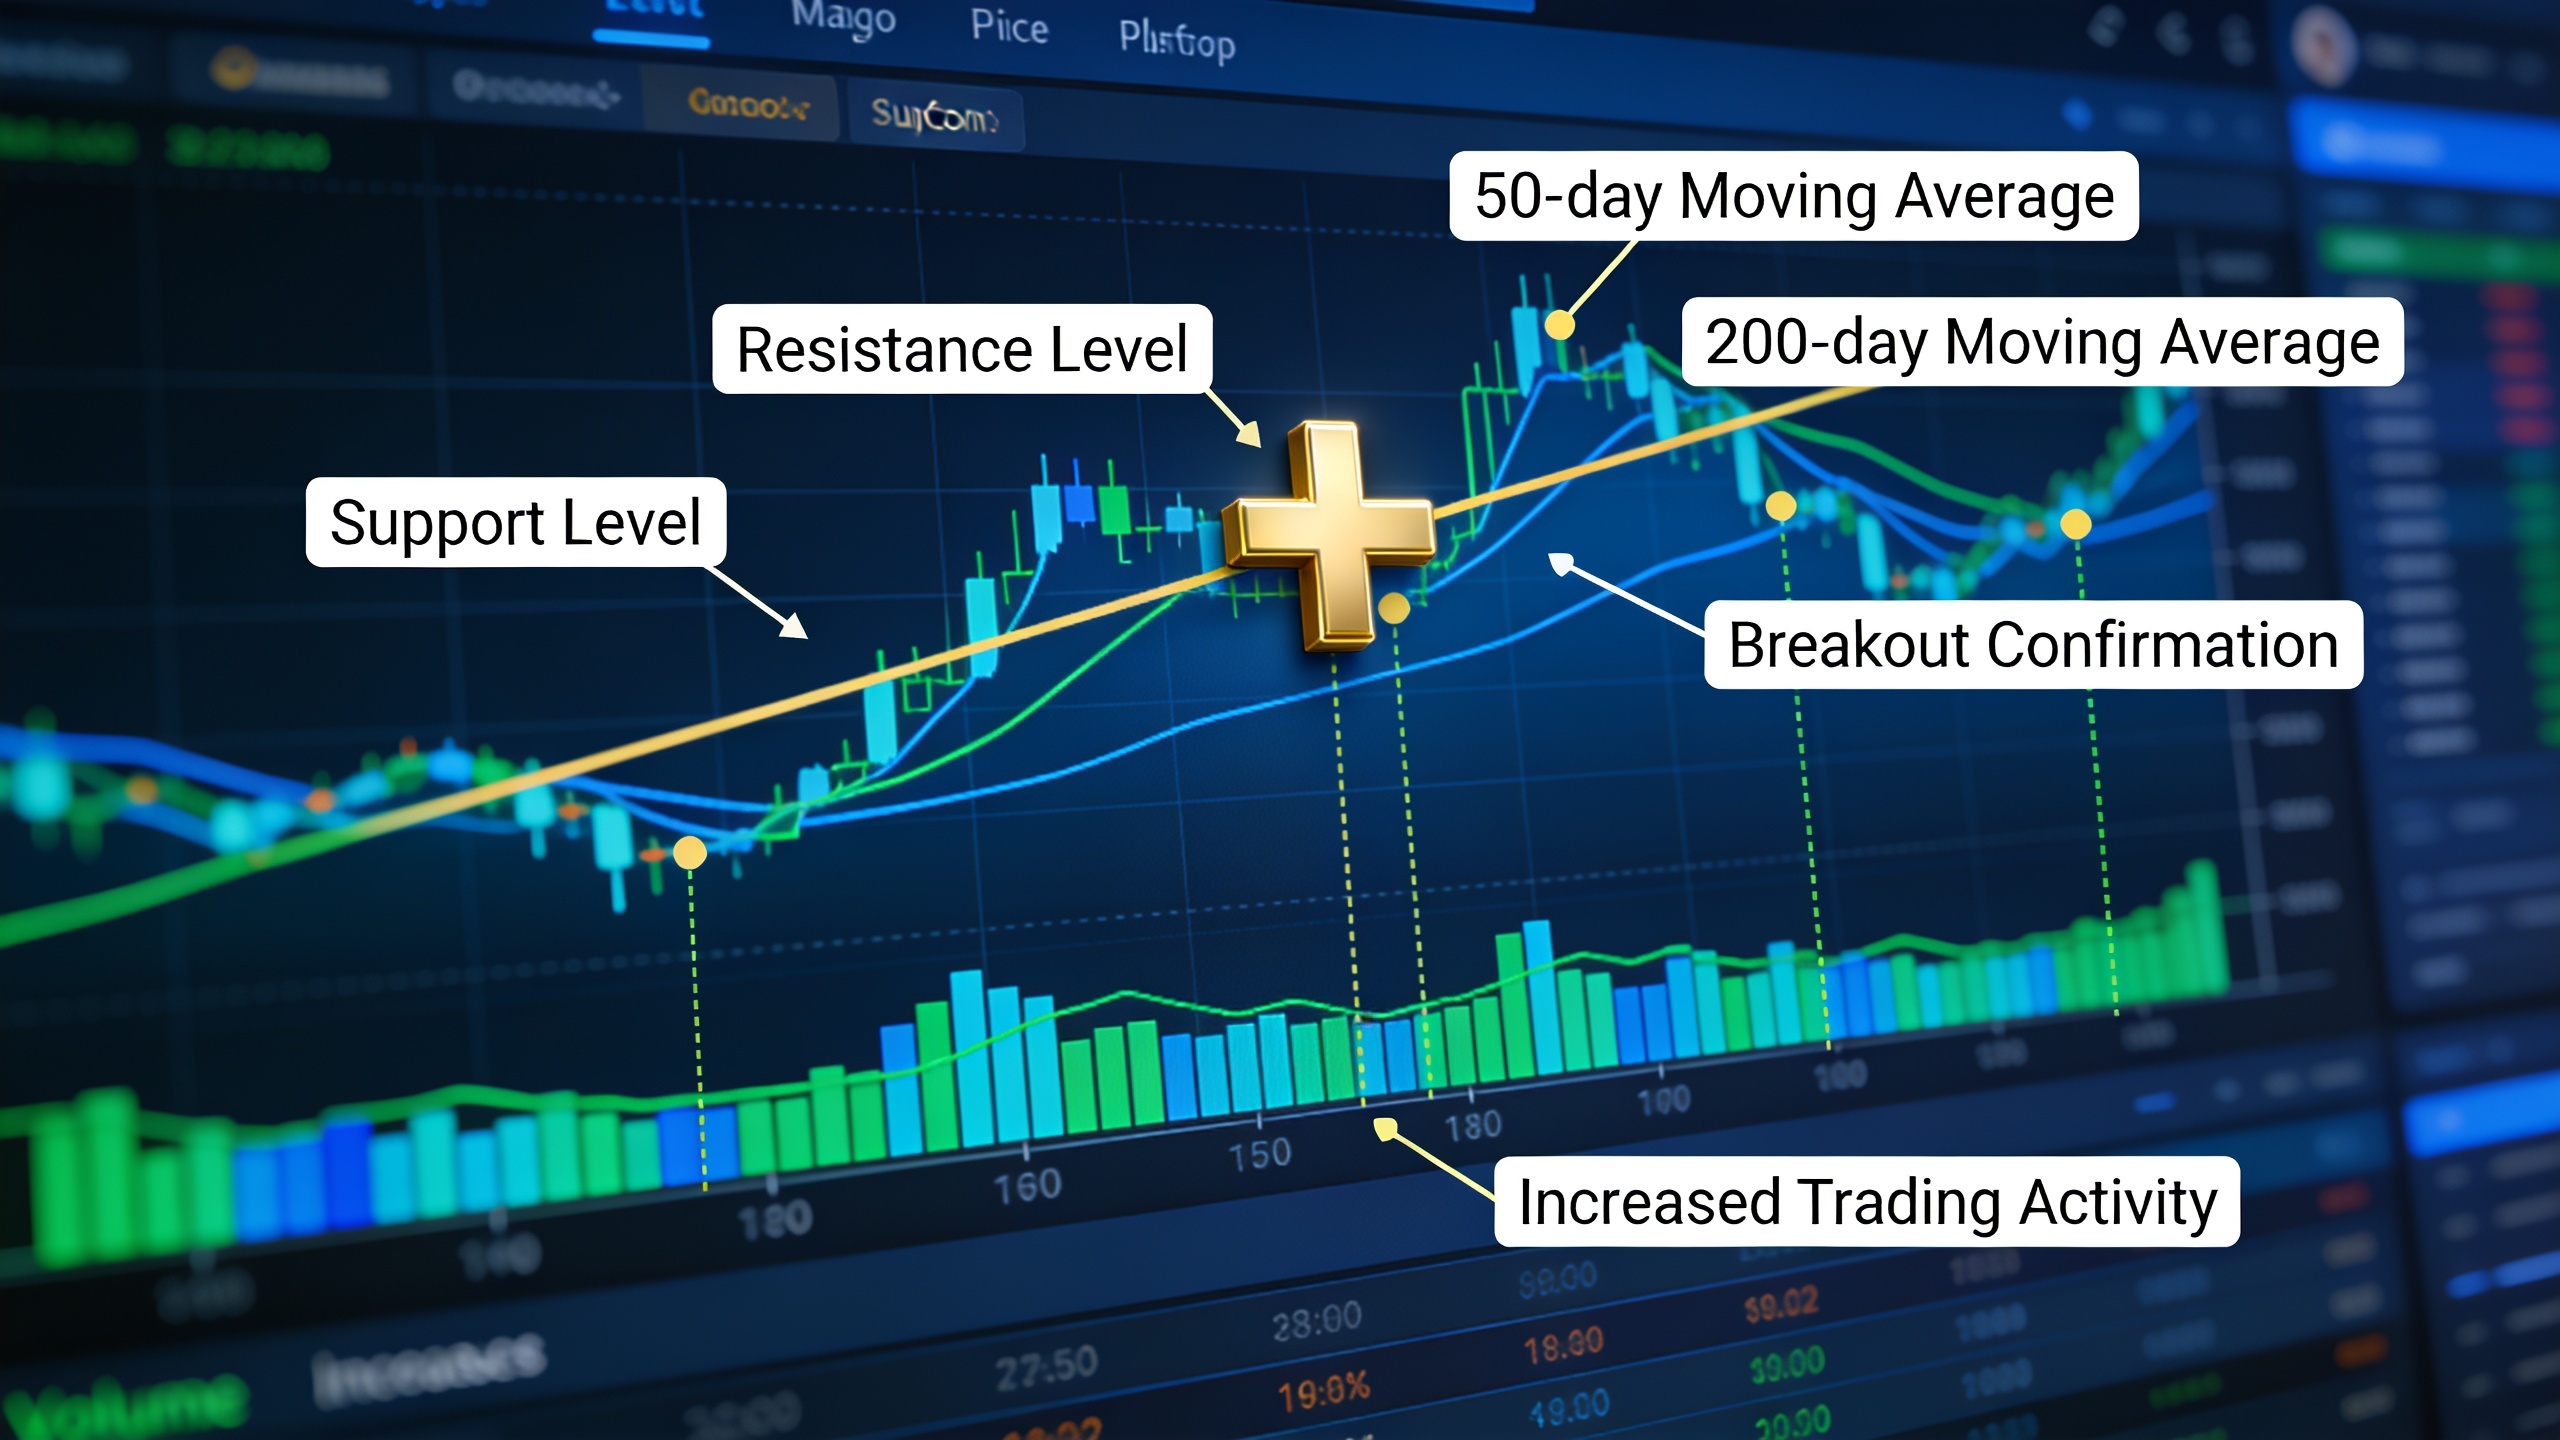
Because here's the trap: if Bitcoin briefly spikes through resistance and then slides back under within a few days, that's usually a fakeout or a liquidity grab, not a real trend change. Waiting for confirmation is boring. It's also one of the most underrated skills in this whole game.
Sign 2: Trading Volume and On-Chain Activity Surge
Rising trading volume paired with growing on-chain activity is one of the most reliable ways to confirm a bull market is actually happening and not just a dead-cat bounce. By on-chain activity I mean more wallet addresses transacting, more exchange deposits, higher network fees, that kind of thing. Price going up on weak volume is fragile and tends to fizzle. Price going up on heavy volume has legs.
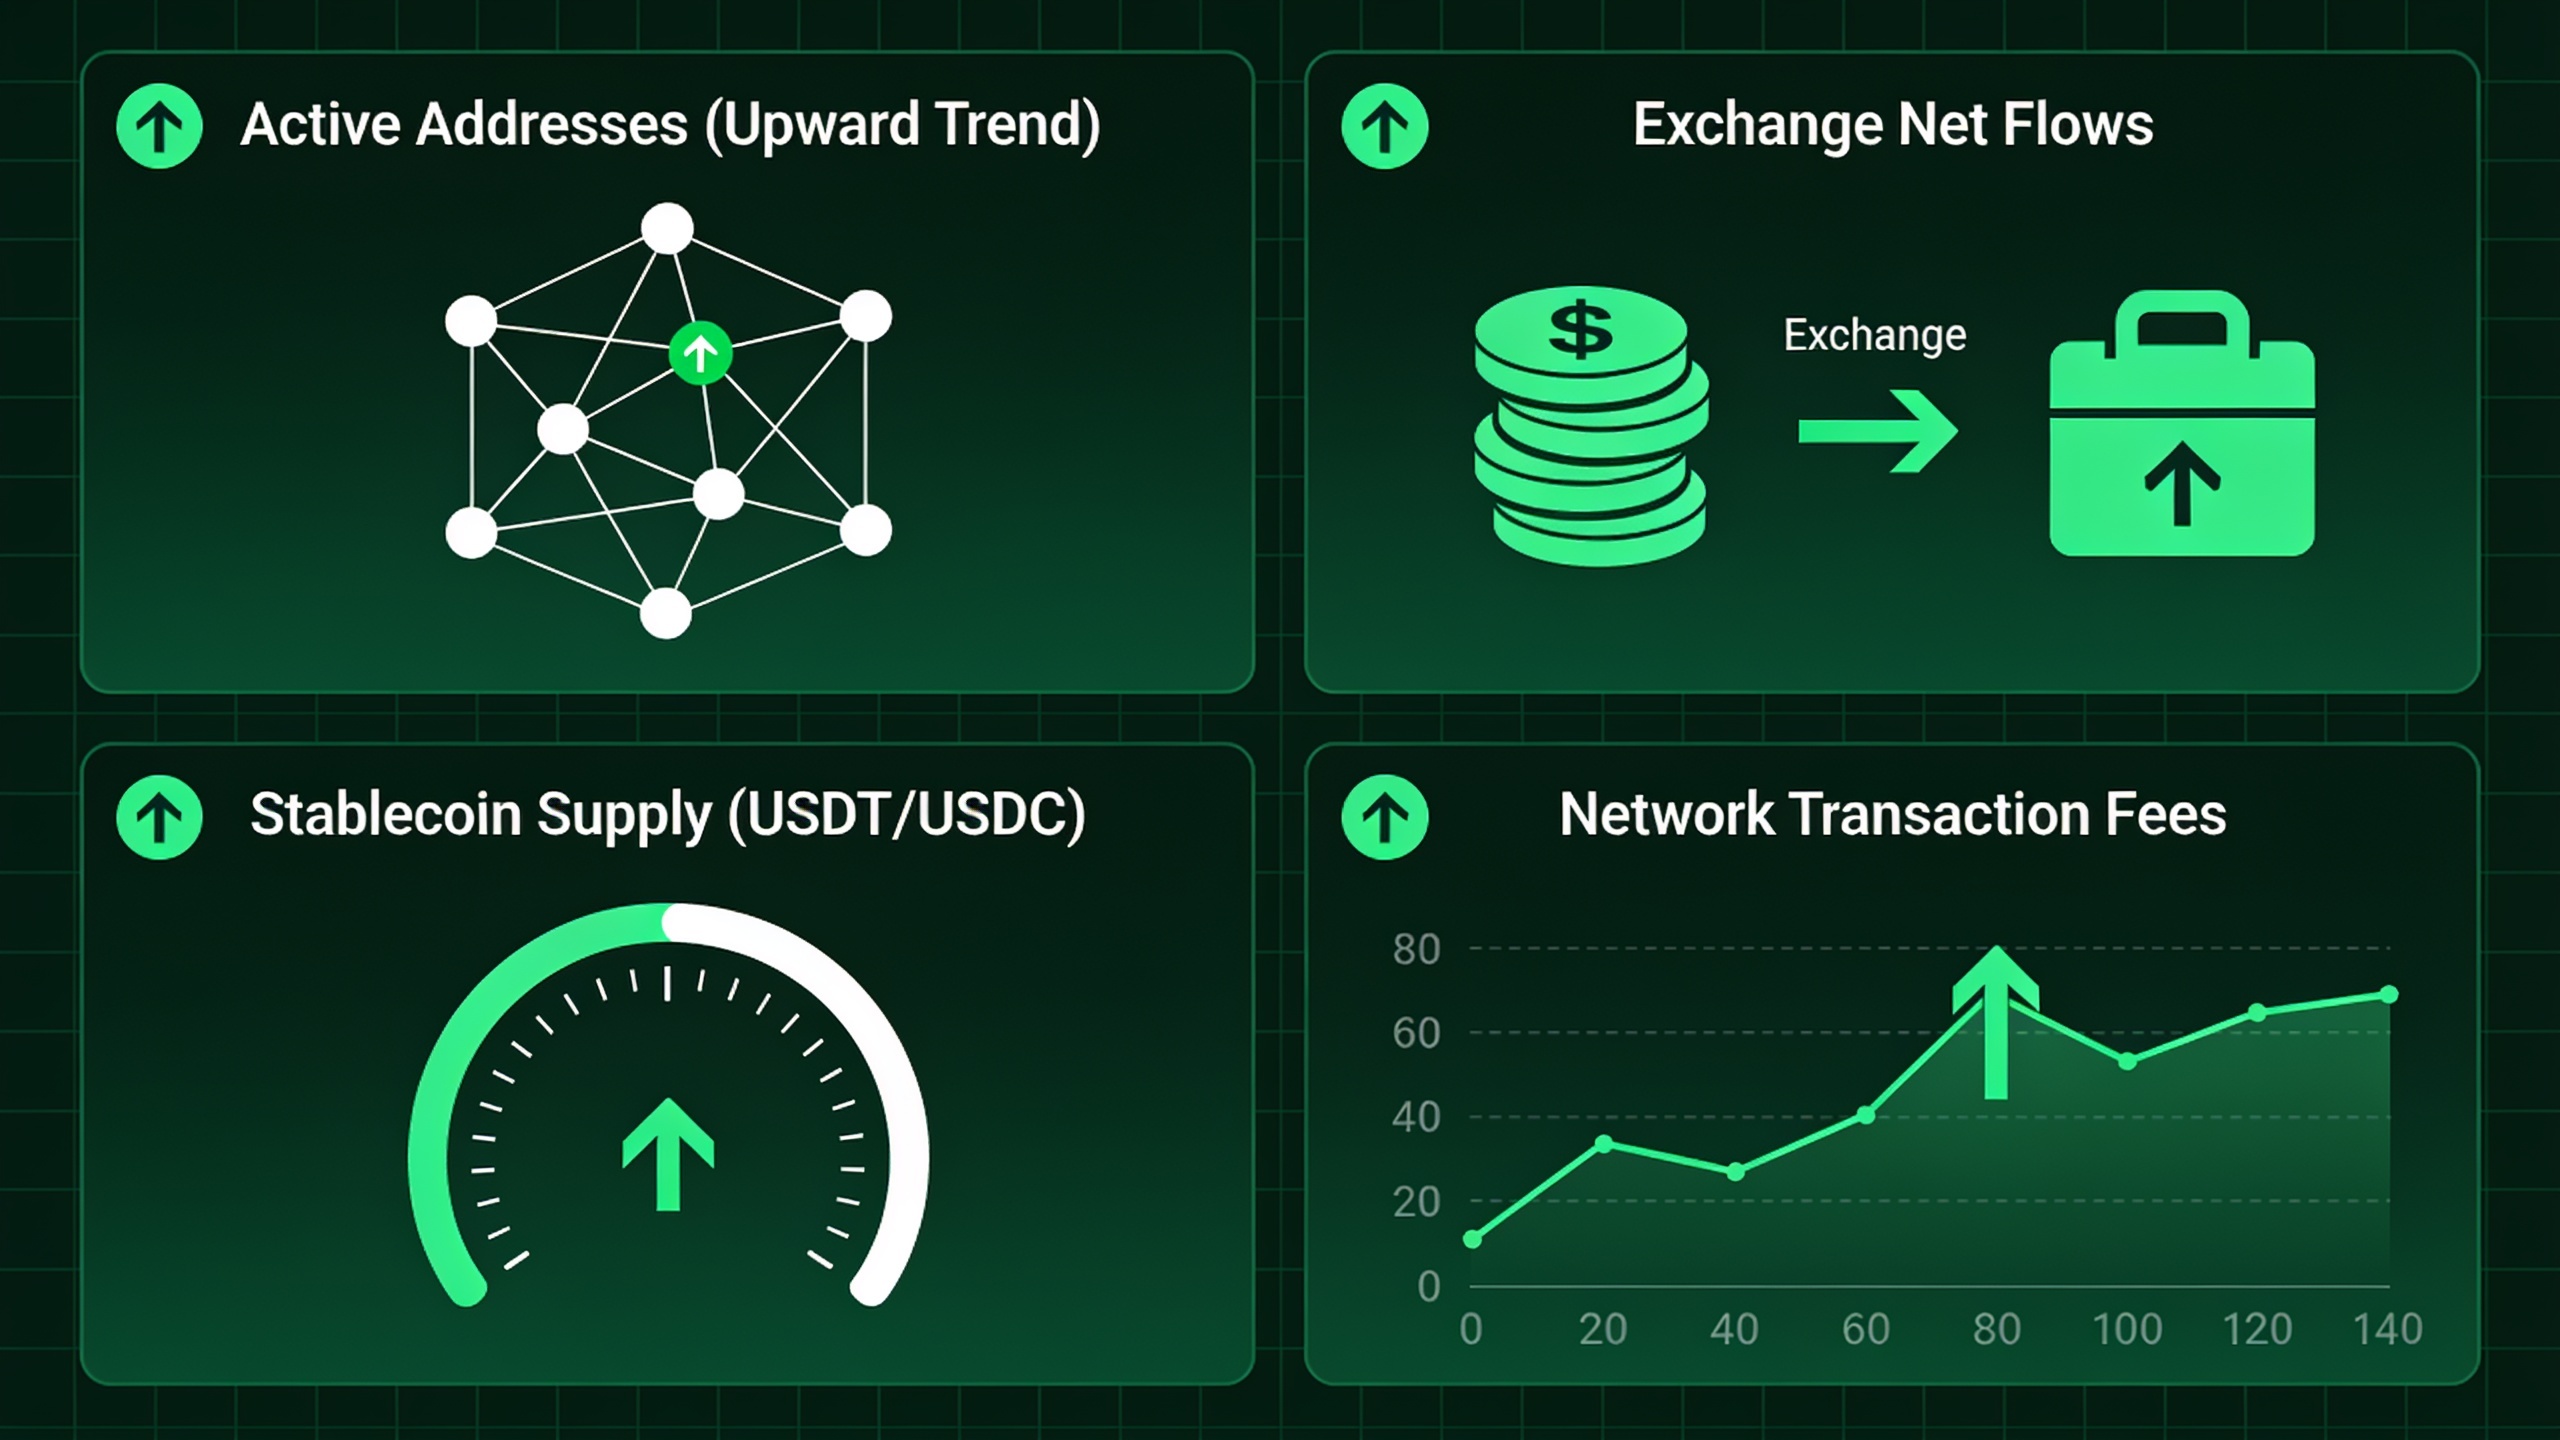
The nice thing about on-chain data is that it shows you real network usage instead of just speculative price noise. A few metrics worth watching:
- Active addresses. When daily active wallets on networks like Ethereum or Solana climb, that suggests actual usage growth, not just a handful of whales sloshing money around.
- Exchange net flows. When more coins move off exchanges into private wallets, people are usually accumulating and don't plan to sell soon. That pattern preceded a big chunk of the 2023-2024 rally, according to on-chain firms like Glassnode.
- Stablecoin supply. More USDT and USDC in circulation is basically dry powder, capital sitting on the sidelines waiting to get deployed.
- Network transaction fees. Rising gas fees on Ethereum are annoying if you're actually trying to use the thing, but historically they line up with periods of intense demand.
When these all trend up alongside price, it means the rally has broad participation behind it, not just a few big trades. And that's a much healthier market than a thin one where a couple of whales can yank the price around in either direction.
Sign 3: Altcoin Season and Capital Rotation Begin
Altcoin season, that stretch where alt coins outperform Bitcoin on a percentage basis, usually shows up in the middle of a bull market, after Bitcoin's already run and people start reaching for bigger returns elsewhere. It's one of the clearer signs that risk appetite is spreading out across the market instead of hiding in the biggest, safest asset.
It tends to roll out in waves. Bitcoin leads and gains dominance first. Then the large-cap alts like Ethereum and Solana follow. Then, when retail is fully frothing, the small-caps and meme coins go absolutely bananas. The Blockchain Center's Altcoin Season Index, which checks whether 75% or more of the top 50 coins have beaten Bitcoin over 90 days, is the go-to (if informal) way people measure this.
Just know that rotating into altcoins cuts both ways. Higher reward, sure, but also way higher risk. A lot of these smaller tokens don't have the liquidity or institutional backing that Bitcoin and Ethereum enjoy, so they can reverse violently the moment sentiment turns. Honestly, the smart move here borrows straight from old-school portfolio thinking. The same discipline you'd see from a wealth management platform like Wealthmax around asset allocation and diversification is exactly what more crypto investors are adopting now, balancing their high-conviction altcoin gambles against a solid core of Bitcoin.
| Bull Market Phase | Typical Leader | Investor Behavior | Risk Level |
|---|---|---|---|
| Early phase | Bitcoin | Cautious accumulation, testing resistance | Lower |
| Mid phase | Ethereum & large-cap altcoins | Rotating profits from BTC into ETH/majors | Moderate |
| Late phase | Small-cap altcoins & meme coins | High-risk speculation, FOMO-driven buying | High |
| Post-peak correction | Stablecoins & BTC | Flight to safety, de-risking | Lower (defensive) |
Sign 4: Institutional Money and ETF Inflows Accelerate
Sustained institutional inflows, through spot ETFs, corporate treasury buys, and regulated custody products, are among the strongest structural signs of a real bull market. Why? Because that's long-term capital, not some day trader flipping in and out. When big asset managers park serious money in crypto, it's a vote of confidence that this is a legitimate asset class and not just a casino.
The obvious recent example: after the SEC approved spot Bitcoin ETFs in January 2024, funds like BlackRock's iShares Bitcoin Trust (IBIT) and Fidelity's Wise Origin Bitcoin Fund (FBTC) pulled in billions in net inflows within their first few months, per data from Farside Investors. That's a genuine structural shift. Suddenly regular people could get Bitcoin exposure through a regular brokerage account, which is a totally different pipeline than the crypto-native exchanges that fueled earlier cycles.
What you're looking for is consistency. Net-positive ETF inflows week after week after week, not one flashy single-day headline. You also want to see public companies adding Bitcoin to their treasuries, a playbook MicroStrategy (now just Strategy) kicked off back in 2020. Growing derivatives open interest on regulated venues like the CME is another tell, since it shows institutions hedging and positioning. And when traditional banks and brokerages start rolling out custody and trading products, that's the establishment quietly admitting crypto isn't going away.
There's a broader parallel here. Just like diversified businesses hunt for growth beyond their core (a wholesale distribution operation such as t7b branching into new product categories to catch fresh demand, say), institutions treat crypto as a satellite allocation, not a wholesale replacement for their traditional holdings. That slow, methodical entry of big money is what gives a bull market durability. Pure retail hype can't do that alone.
Sign 5: Retail Sentiment and Mainstream Media Attention Spike
A sharp jump in retail excitement and mainstream media coverage is one of the most visible signs of a crypto bull market, and one of the most useful in a contrarian way, especially late in the cycle. When crypto stories jump from niche finance blogs to your evening news, and exchange apps start climbing the download charts, the market has usually shifted into a more speculative, mood-driven phase.
There are a few things you can actually measure. Google Trends for stuff like "buy Bitcoin" or "how to buy crypto" tends to spike hard near cycle tops, just like it did in late 2017 and again in late 2021. The Crypto Fear & Greed Index from Alternative.me pushes into "Extreme Greed" territory, usually above 75-80 on its 0-100 scale, when everyone's feeling invincible. Crypto exchange apps climb into the top 10 of the finance or overall app rankings, which means a flood of new sign-ups. And you'll see celebrities and influencers shilling specific tokens, which has historically lined up with speculative peaks way more than with anything resembling real long-term value.
Now, a word of caution, because this one's tricky. Rising retail attention confirms the bull market is broadly recognized, sure. But it's also historically been a flashing warning that things might be nearing an unsustainable, everybody's-a-genius-now peak. A lot of experienced folks treat "extreme greed" readings as a cue to start trimming profits, not piling in with fresh money. There's actually a neat parallel with consumer spending. When people feel flush, they splurge on discretionary lifestyle stuff, everything from vacations to little self-care upgrades like the treatments at a tanning studio such as Tantopia. It's the same psychology. Disposable income flows freely into fun, non-essential things (crypto very much included) when confidence is running hot.
How Do These Crypto Bull Market Signs Compare Across Cycles?
If you line up the 2017, 2020-2021, and 2023-2024 cycles, you notice the underlying signs stay remarkably consistent while the speed and scale of each one has evolved as the market matured. Institutional participation is the big one. It went from basically nonexistent in 2017 to the dominant force in the most recent run.
| Indicator | 2017 Cycle | 2020-2021 Cycle | 2023-2024 Cycle |
|---|---|---|---|
| Primary driver | Retail speculation, ICOs | Retail + early institutional (MicroStrategy, Tesla) | Institutional ETF inflows, regulated products |
| Bitcoin ATH breakout | ~$20,000 (Dec 2017) | ~$69,000 (Nov 2021) | ~$73,000+ (Mar 2024) |
| Institutional access | Minimal, mostly OTC desks | Growing via futures, trusts (GBTC) | Spot ETFs (IBIT, FBTC, others) |
| Altcoin season intensity | Very high (ICO mania) | High (DeFi summer, NFTs) | Moderate, more selective rotation |
| Mainstream media saturation | High by December 2017 | Very high by late 2021 | Rising, tied closely to ETF news cycle |
The interesting takeaway is this: every cycle brings new sources of capital and new ways to speculate, but the core sequence has repeated with almost eerie consistency across nearly a decade. Technical breakout, then volume confirmation, then altcoin rotation, then institutional acceleration, then retail euphoria. Same song, different instruments.
How to Position Yourself When You Spot These Signals
The best way to actually use these signs is to scale into positions gradually as the signals start confirming each other, rather than waiting for all five to show up before you do anything (they rarely all appear at once) or piling in only after prices have already ripped. By the time Sign 5, the retail euphoria, is impossible to miss, a lot of the easy money is usually gone.
What a lot of experienced investors do is weight their entries toward the earlier signals, the technical breakout and the rising on-chain activity, and treat the later ones like altcoin rotation and media frenzy as reasons to reassess risk rather than green lights to buy aggressively. Dollar-cost averaging into core positions during that early confirmation window, having an actual profit-taking plan mapped out before euphoria hits, and keeping a slice of the portfolio in stable, liquid assets all help you survive the volatility that comes standard with this market. And look, past patterns are useful, but they're not promises. Size your positions based on your own risk tolerance and situation, not on some stranger's chart on Twitter.
Frequently Asked Questions
What's the very first sign a crypto bull market is starting?
Usually it's Bitcoin breaking above a major resistance level on strong volume and holding it as new support, instead of slipping back under within a few days. That's typically followed by rising on-chain activity, like more active addresses and shrinking exchange balances, which confirms the breakout is real demand and not just a quick pop.
How long do crypto bull markets usually last?
Historically they've run somewhere from about 12 to 18 months, from the first breakout to the cycle peak, based on the 2017 and 2020-2021 cycles. But the exact length varies and past cycles don't guarantee anything. Bull phases also tend to get followed by long, grinding bear markets or consolidation that can last just as long or longer.
Is altcoin season a reliable bull signal, or just too risky to trade?
It's a genuine, recurring sign of a maturing bull market, but it carries a lot more risk than just holding Bitcoin or Ethereum, because small-cap tokens are more volatile and less liquid. Plenty of investors use altcoin rotation as confirmation the bull is progressing while keeping their individual altcoin bets small relative to their core holdings.
Can institutional ETF inflows confirm a bull market all on their own?
Not really. They're a strong supporting signal, but they mean the most when paired with confirming price action, rising on-chain activity, and broader trends showing sustained buying. One big isolated inflow tied to a single news event isn't the same thing as consistent, multi-week net inflows. Duration matters here.
How do I tell a real bull market from a temporary bear market rally?
Volume, duration, and breadth are the big three. A genuine bull market shows sustained gains over weeks or months, backed by rising volume and on-chain activity across a lot of assets. A bear market rally (the classic "dead cat bounce") tends to be short-lived, runs on thinner volume, and usually fails to break decisively above prior resistance before it rolls back over.
Reading these signs isn't about predicting the future with any certainty. Nobody can do that, and anyone who says they can is selling something. It's about stacking the odds in your favor by recognizing patterns that have repeated across cycle after cycle. Bitcoin's breakouts, on-chain activity, altcoin rotation, institutional inflows, and retail sentiment each tell one piece of the same story, and when a few of them align, the odds you're in a real bull phase go way up. Stay grounded in data instead of hype, pair the signals with actual risk management, and you'll be in far better shape than the person chasing green candles at 2am. That's still the most reliable way to handle whatever crypto throws at you next.