Bitcoin Dominance Explained: What It Signals for Altcoins
If you've spent any real time staring at a crypto trading terminal, you've definitely seen that little chart labeled "BTC.D" hanging out next to the price candles. Most people ignore it. That's a...

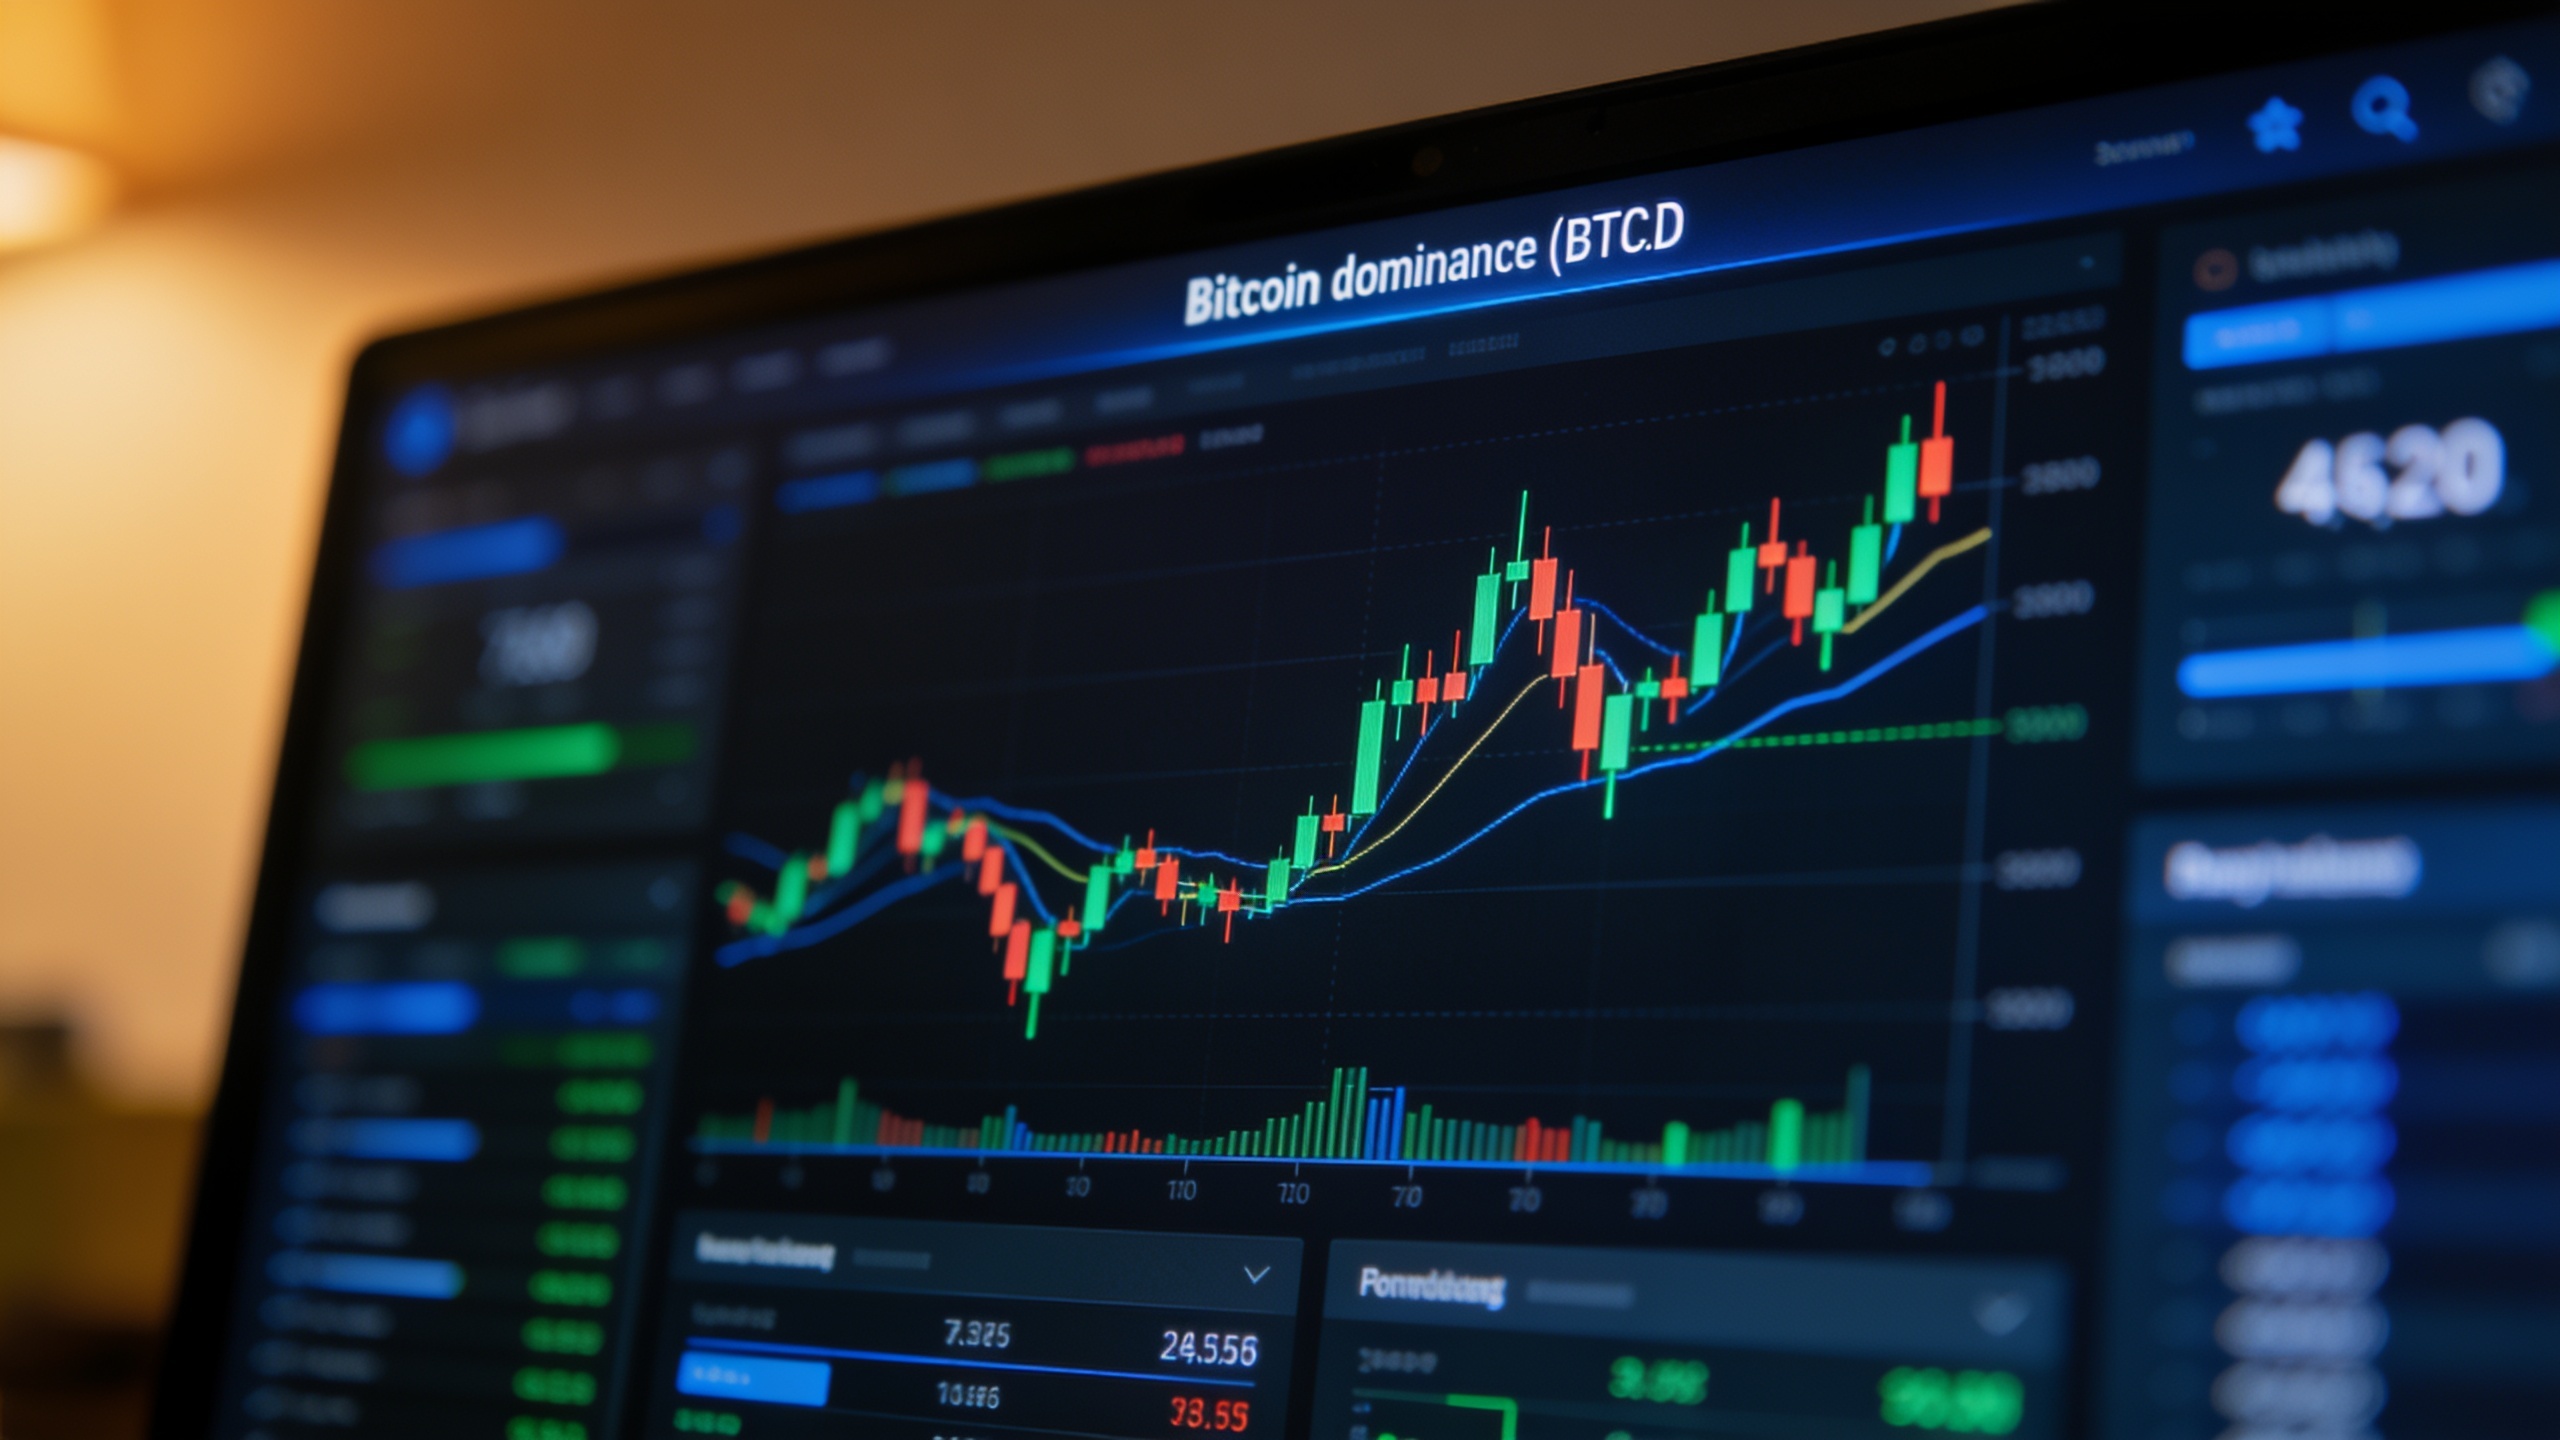
If you've spent any real time staring at a crypto trading terminal, you've definitely seen that little chart labeled "BTC.D" hanging out next to the price candles. Most people ignore it. That's a mistake. This whole piece is about what that number actually measures, how it gets calculated, and (the part everyone actually cares about) what its movements tend to mean for the thousands of altcoins trading alongside Bitcoin. Get comfortable reading this one ratio and you'll start noticing capital rotations before they slap you in the face.
Bitcoin dominance is one of those numbers that traders obsess over and, frankly, half of them misunderstand. People treat it like a compass for market sentiment, and sure, it's useful. But it's not a crystal ball, and it behaves completely differently depending on where we are in the cycle. So let's actually get into the mechanics, the history, and how people use it in practice, including its reputation as an unofficial altcoin season indicator.
Table of Contents
- What Is Bitcoin Dominance?
- How Is Bitcoin Dominance Calculated?
- Bitcoin Dominance Explained Through Market History
- What Rising Bitcoin Dominance Signals
- What Falling Bitcoin Dominance Signals
- Bitcoin Dominance as an Altcoin Season Indicator
- How to Track and Use Bitcoin Dominance in a Trading Strategy
- Limitations of Bitcoin Dominance Explained
- FAQ
- Final Thoughts
What Is Bitcoin Dominance?
Bitcoin dominance is the percentage of the entire crypto market's total value that belongs to Bitcoin alone. That's it. If the whole market is one big pie, dominance is just how big Bitcoin's slice is.
Quick example so it sticks. Say the total crypto market cap across every coin and token adds up to $2 trillion, and Bitcoin's own market cap is $1.1 trillion. That puts dominance at 55%. And this number never sits still, because both Bitcoin's price and the combined value of every altcoin on earth are moving in real time, usually at different speeds.
Here's the part people forget: dominance isn't a measure of price, or adoption, or how many transactions are happening. It's purely a comparison of market capitalization between Bitcoin and everything else, including Ethereum, stablecoins, and the endless long tail of tiny projects nobody's heard of. And because it's a ratio, weird things happen. Dominance can climb even while Bitcoin's price sits flat. It can drop while Bitcoin's price is actually going up, as long as altcoins are going up faster. That trips up a lot of newer traders.
How Is Bitcoin Dominance Calculated?
You calculate Bitcoin dominance by dividing Bitcoin's total market cap by the total market cap of all cryptocurrencies combined, then multiplying by 100 to get a percentage. The formula's about as simple as it gets:
Bitcoin Dominance (%) = (Bitcoin Market Cap ÷ Total Crypto Market Cap) × 100
Market cap itself is just a coin's current price times its circulating supply. Bitcoin's is relatively clean to figure out because it has a fixed max supply of 21 million coins. Compare that to some altcoins juggling inflationary emissions, token burns, and huge chunks of supply locked up in vesting contracts, and you start to appreciate how straightforward Bitcoin actually is.
Data aggregators like CoinMarketCap and CoinGecko crunch this constantly, pulling price and supply numbers from exchanges and blockchain explorers to spit out real-time dominance charts. Some platforms also give you variations, like dominance excluding stablecoins, which honestly gives a cleaner read on how money is actually rotating between risk assets rather than getting muddied by all those dollar-pegged tokens (USDT, USDC) parked on the sidelines.
And that stablecoin thing matters more than people think. Stablecoins now make up a meaningful share of total crypto market cap, so raw dominance figures can quietly overstate or understate sentiment depending on how much cash is sitting in stablecoins at any moment. It's a nuance that vanishes the second someone glances at the headline number and calls it a day.
Bitcoin Dominance Explained Through Market History
Over the whole life of crypto, Bitcoin dominance has swung all over the place, but the long-term trend has generally drifted downward as more tokens and ecosystems piled into existence. It still spikes higher during scary, risk-off stretches. Back in the earliest days, before Ethereum and the ICO circus, Bitcoin basically was the market, mostly because there wasn't much else worth holding.
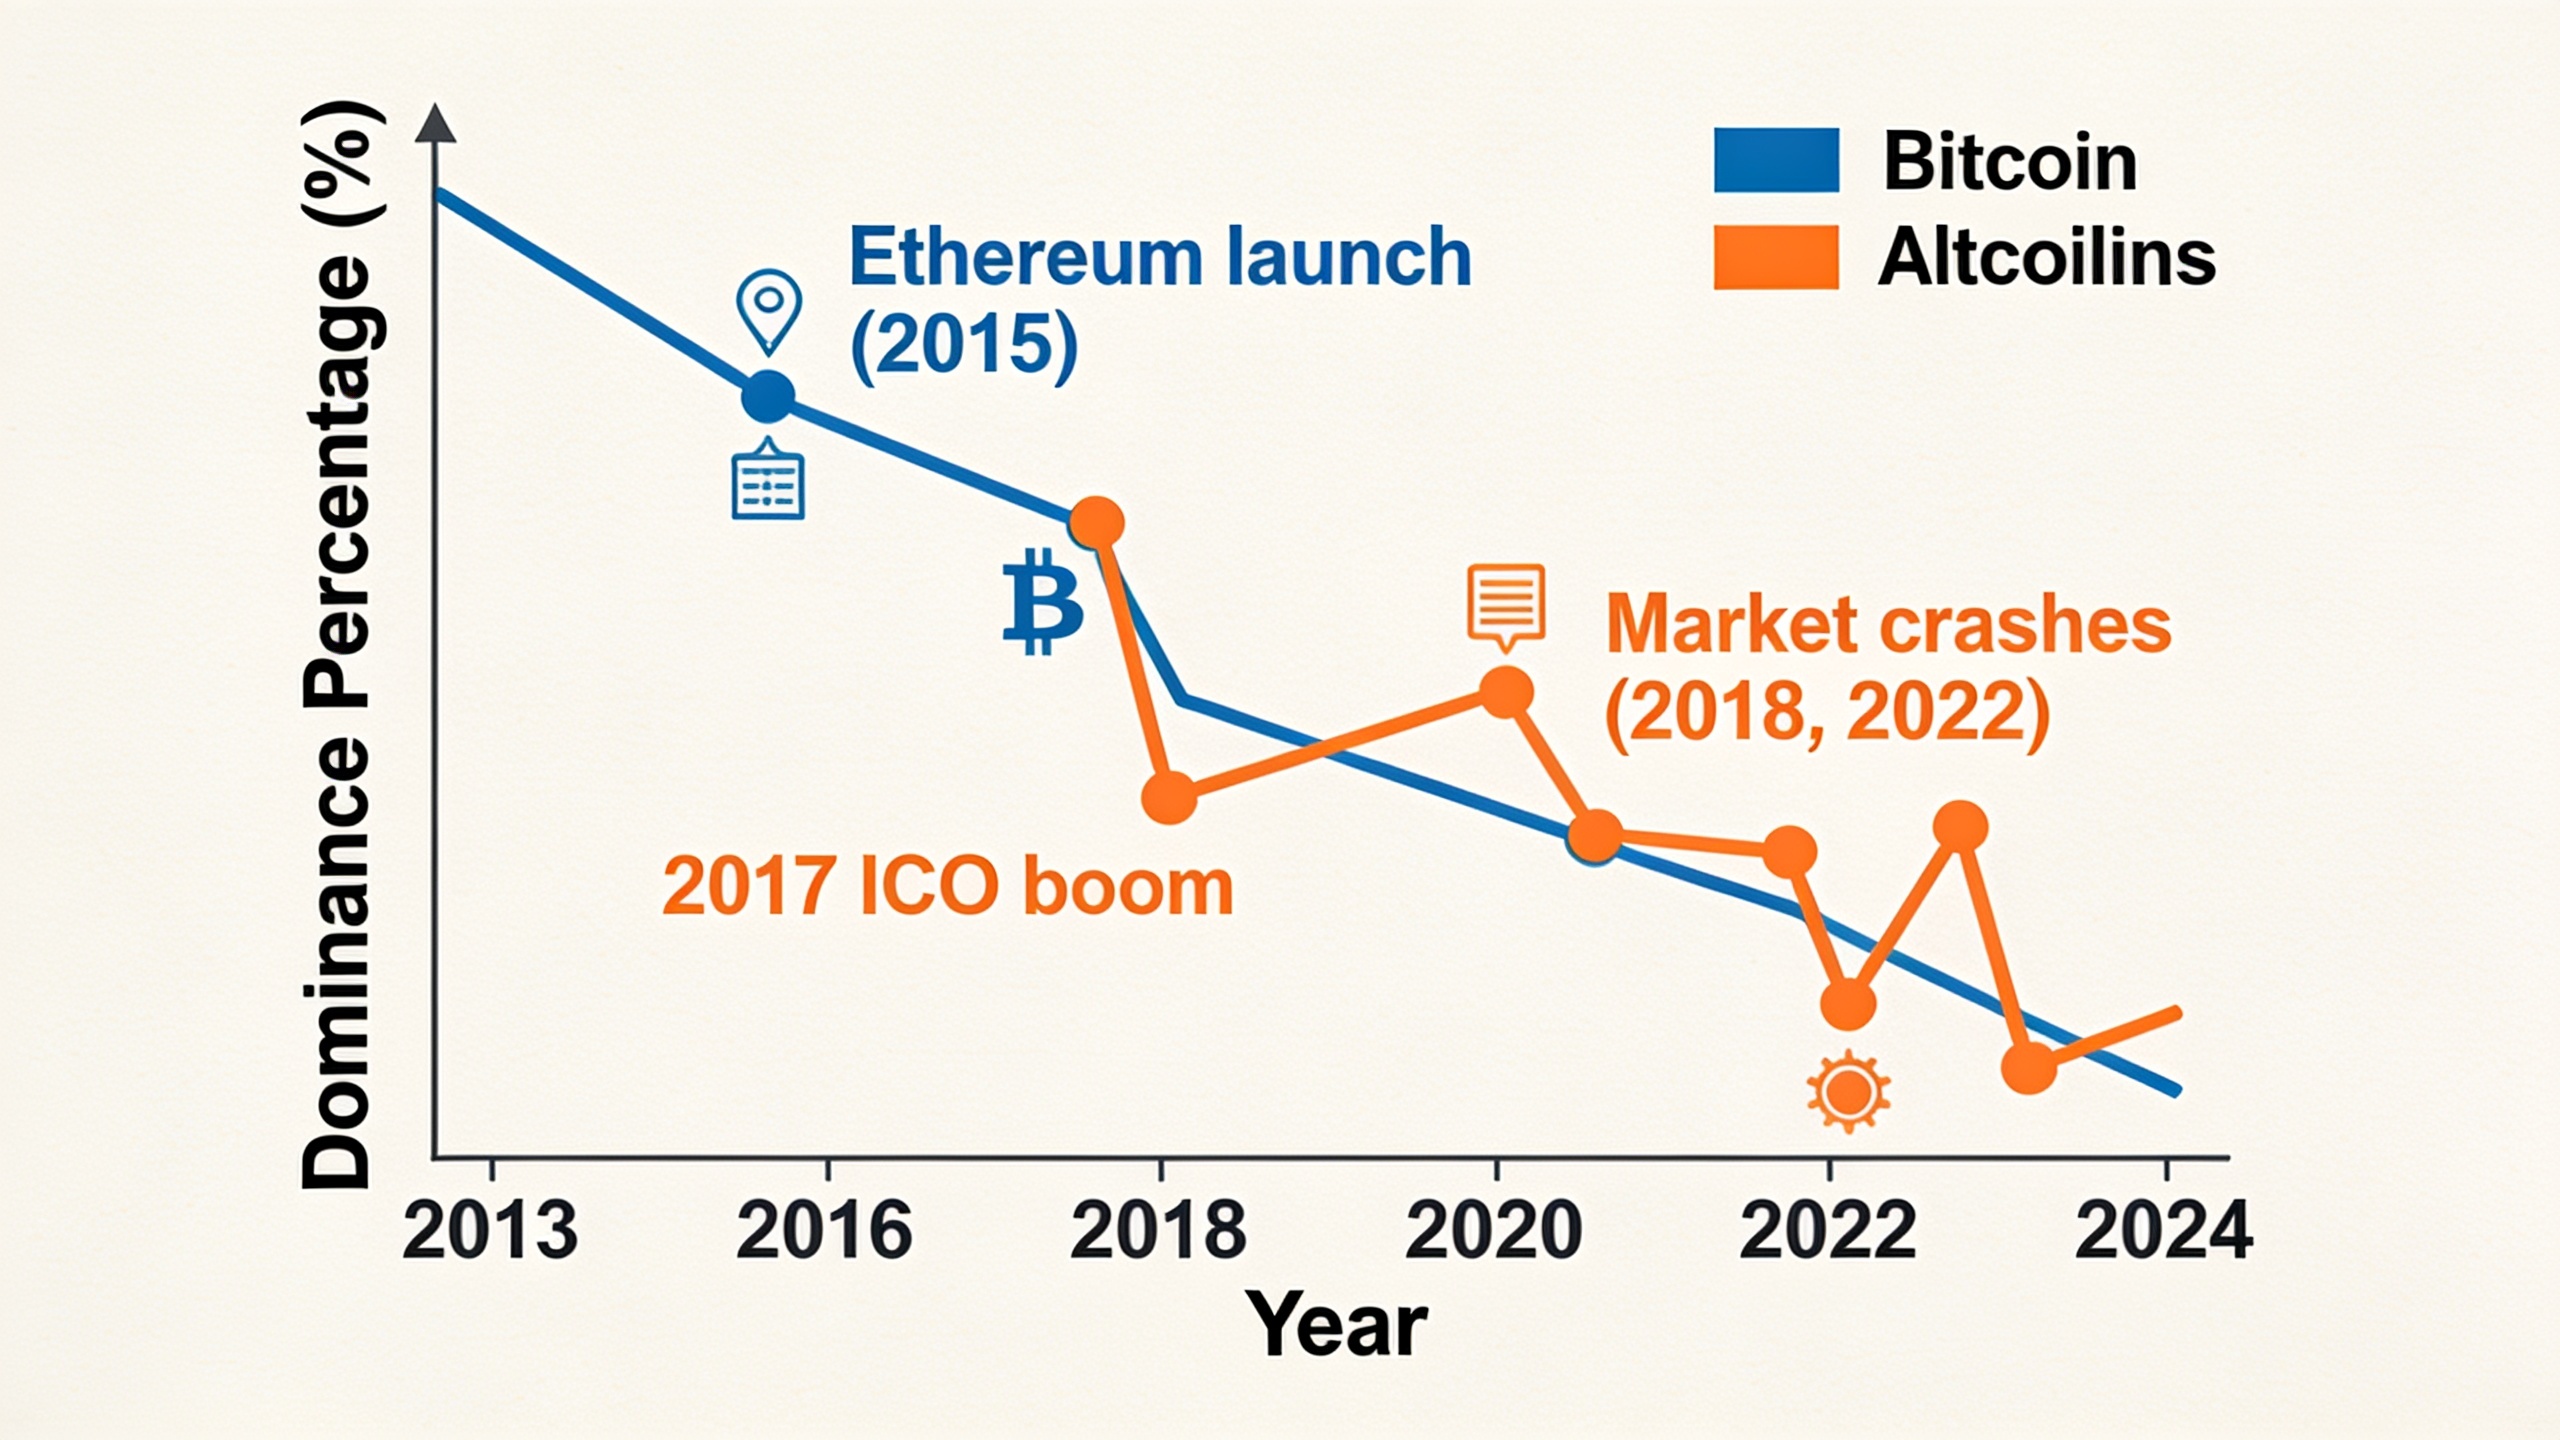
Then Ethereum showed up, the 2017 ICO boom flooded the market with new projects, and dominance slid as money spread out into all these shiny new things. But whenever the market gets stressed, capital has a habit of running back to Bitcoin, which pushes dominance up again. Traders see it as the most liquid, most battle-tested crypto asset. Call it a flight to safety within crypto, though I'd push back on anyone calling Bitcoin a true safe haven in the traditional-finance sense. It isn't.
That back-and-forth is the whole game. Dominance falls as people get greedy, then rises again as everyone de-risks. It never moves in a clean line, though, and long stretches of dominance just chopping sideways for weeks while the market waits for a catalyst are completely normal. Don't read too much into every wiggle.
What Rising Bitcoin Dominance Signals
Rising Bitcoin dominance usually means capital is flowing into Bitcoin relative to altcoins, and that tends to happen during uncertain periods, early recoveries after a crash, or when big institutional money floods in specifically targeting Bitcoin. Important catch: this doesn't automatically mean Bitcoin's price is going up. Dominance can rise simply because altcoins are bleeding out faster than Bitcoin during a broad downturn.
A few situations usually drive it. The first is a flight to relative safety, where sentiment turns cautious and traders dump the small, volatile alts first and huddle into Bitcoin for its deeper liquidity and longer track record. The second is institutional and ETF demand. When large pools of money (think spot Bitcoin ETF inflows in regulated markets) enter the space, that demand is structurally concentrated in Bitcoin, not sprinkled across thousands of altcoins, which mechanically drags dominance higher.
And then there's the start of a new cycle. Historically, Bitcoin leads the early recovery before capital slowly rotates outward, first into the bigger altcoins, then eventually into the small-cap stuff. So when you see dominance grinding higher for a sustained stretch, most traders take it as a nudge to be careful with altcoin bets, since alts tend to lag Bitcoin both on the way down and in the early innings of a recovery.
What Falling Bitcoin Dominance Signals
Falling Bitcoin dominance means altcoins are gaining market share relative to Bitcoin, which people generally read as a sign of rising risk appetite and speculative money rotating around the market. This is the phase everyone loosely calls "altcoin season."
But watch the trap here. When dominance falls, it could mean one of two very different things. Either altcoin prices rose faster than Bitcoin's, or Bitcoin's price fell while altcoins held steadier or fell less. Both push the ratio the same direction. That's exactly why you can't read dominance in a vacuum, you have to look at actual price action next to it.
Falling dominance usually shows up alongside a handful of recognizable signs: growing retail volume and social media buzz around specific sectors (DeFi tokens, layer-2 projects, meme coins, whatever's hot that month), Ethereum and other large caps outperforming Bitcoin for a sustained multi-week stretch, and fresh money entering the market hunting for higher-risk, higher-reward plays beyond Bitcoin.
None of this means every altcoin wins, though. Even when dominance is dropping, the rotation tends to reward the big, liquid altcoins first. The smaller, thinner tokens often lag badly or get skipped entirely. If you're holding a bag of obscure microcaps waiting for your turn, well, sometimes it just never comes.
Bitcoin Dominance as an Altcoin Season Indicator
Bitcoin dominance is one of the most cited tools people lean on as an altcoin season indicator, because a sustained decline in dominance has historically lined up with periods where a broad basket of altcoins beats Bitcoin. The logic isn't complicated: if the altcoin share of total market cap is growing while Bitcoin's shrinks, it means traders are collectively leaning toward alts during that window.
That said, dominance on its own is a pretty blunt instrument. It tells you money is rotating out of Bitcoin in aggregate, but it won't tell you which altcoins are winning, how broad the move is, or whether the whole thing is just Ethereum doing the heavy lifting. Which is why traders usually pair dominance with something like an "altcoin season index" that specifically measures what percentage of the top altcoins by market cap have beaten Bitcoin over a rolling window, usually 90 days.
There's a rough, informal rule floating around: the market's in "altcoin season" when a large majority of top-ranked altcoins have outperformed Bitcoin recently, and it's "Bitcoin season" when the opposite holds. Falling dominance tends to track alongside these readings, though not always at the same pace, since dominance is market-cap-weighted and Ethereum's massive share of total altcoin cap can skew it hard.
If you're trying to time your exposure between Bitcoin and alts, my honest advice is to wait for a clear, multi-week breakdown in dominance rather than reacting to a single day's move. One-day swings are noisy and often just reflect a couple of large caps being volatile, not some genuine market-wide rotation. Patience beats twitchiness here almost every time.
How to Track and Use Bitcoin Dominance in a Trading Strategy
Bitcoin dominance shows up in real time on basically every major crypto data platform, including CoinMarketCap, CoinGecko, and TradingView, usually as a line chart labeled "BTC.D" that you can throw right next to Bitcoin's price for a direct comparison. Most platforms even let you overlay dominance against a specific altcoin's price to see whether that coin is gaining or losing relative strength. Handy little trick.
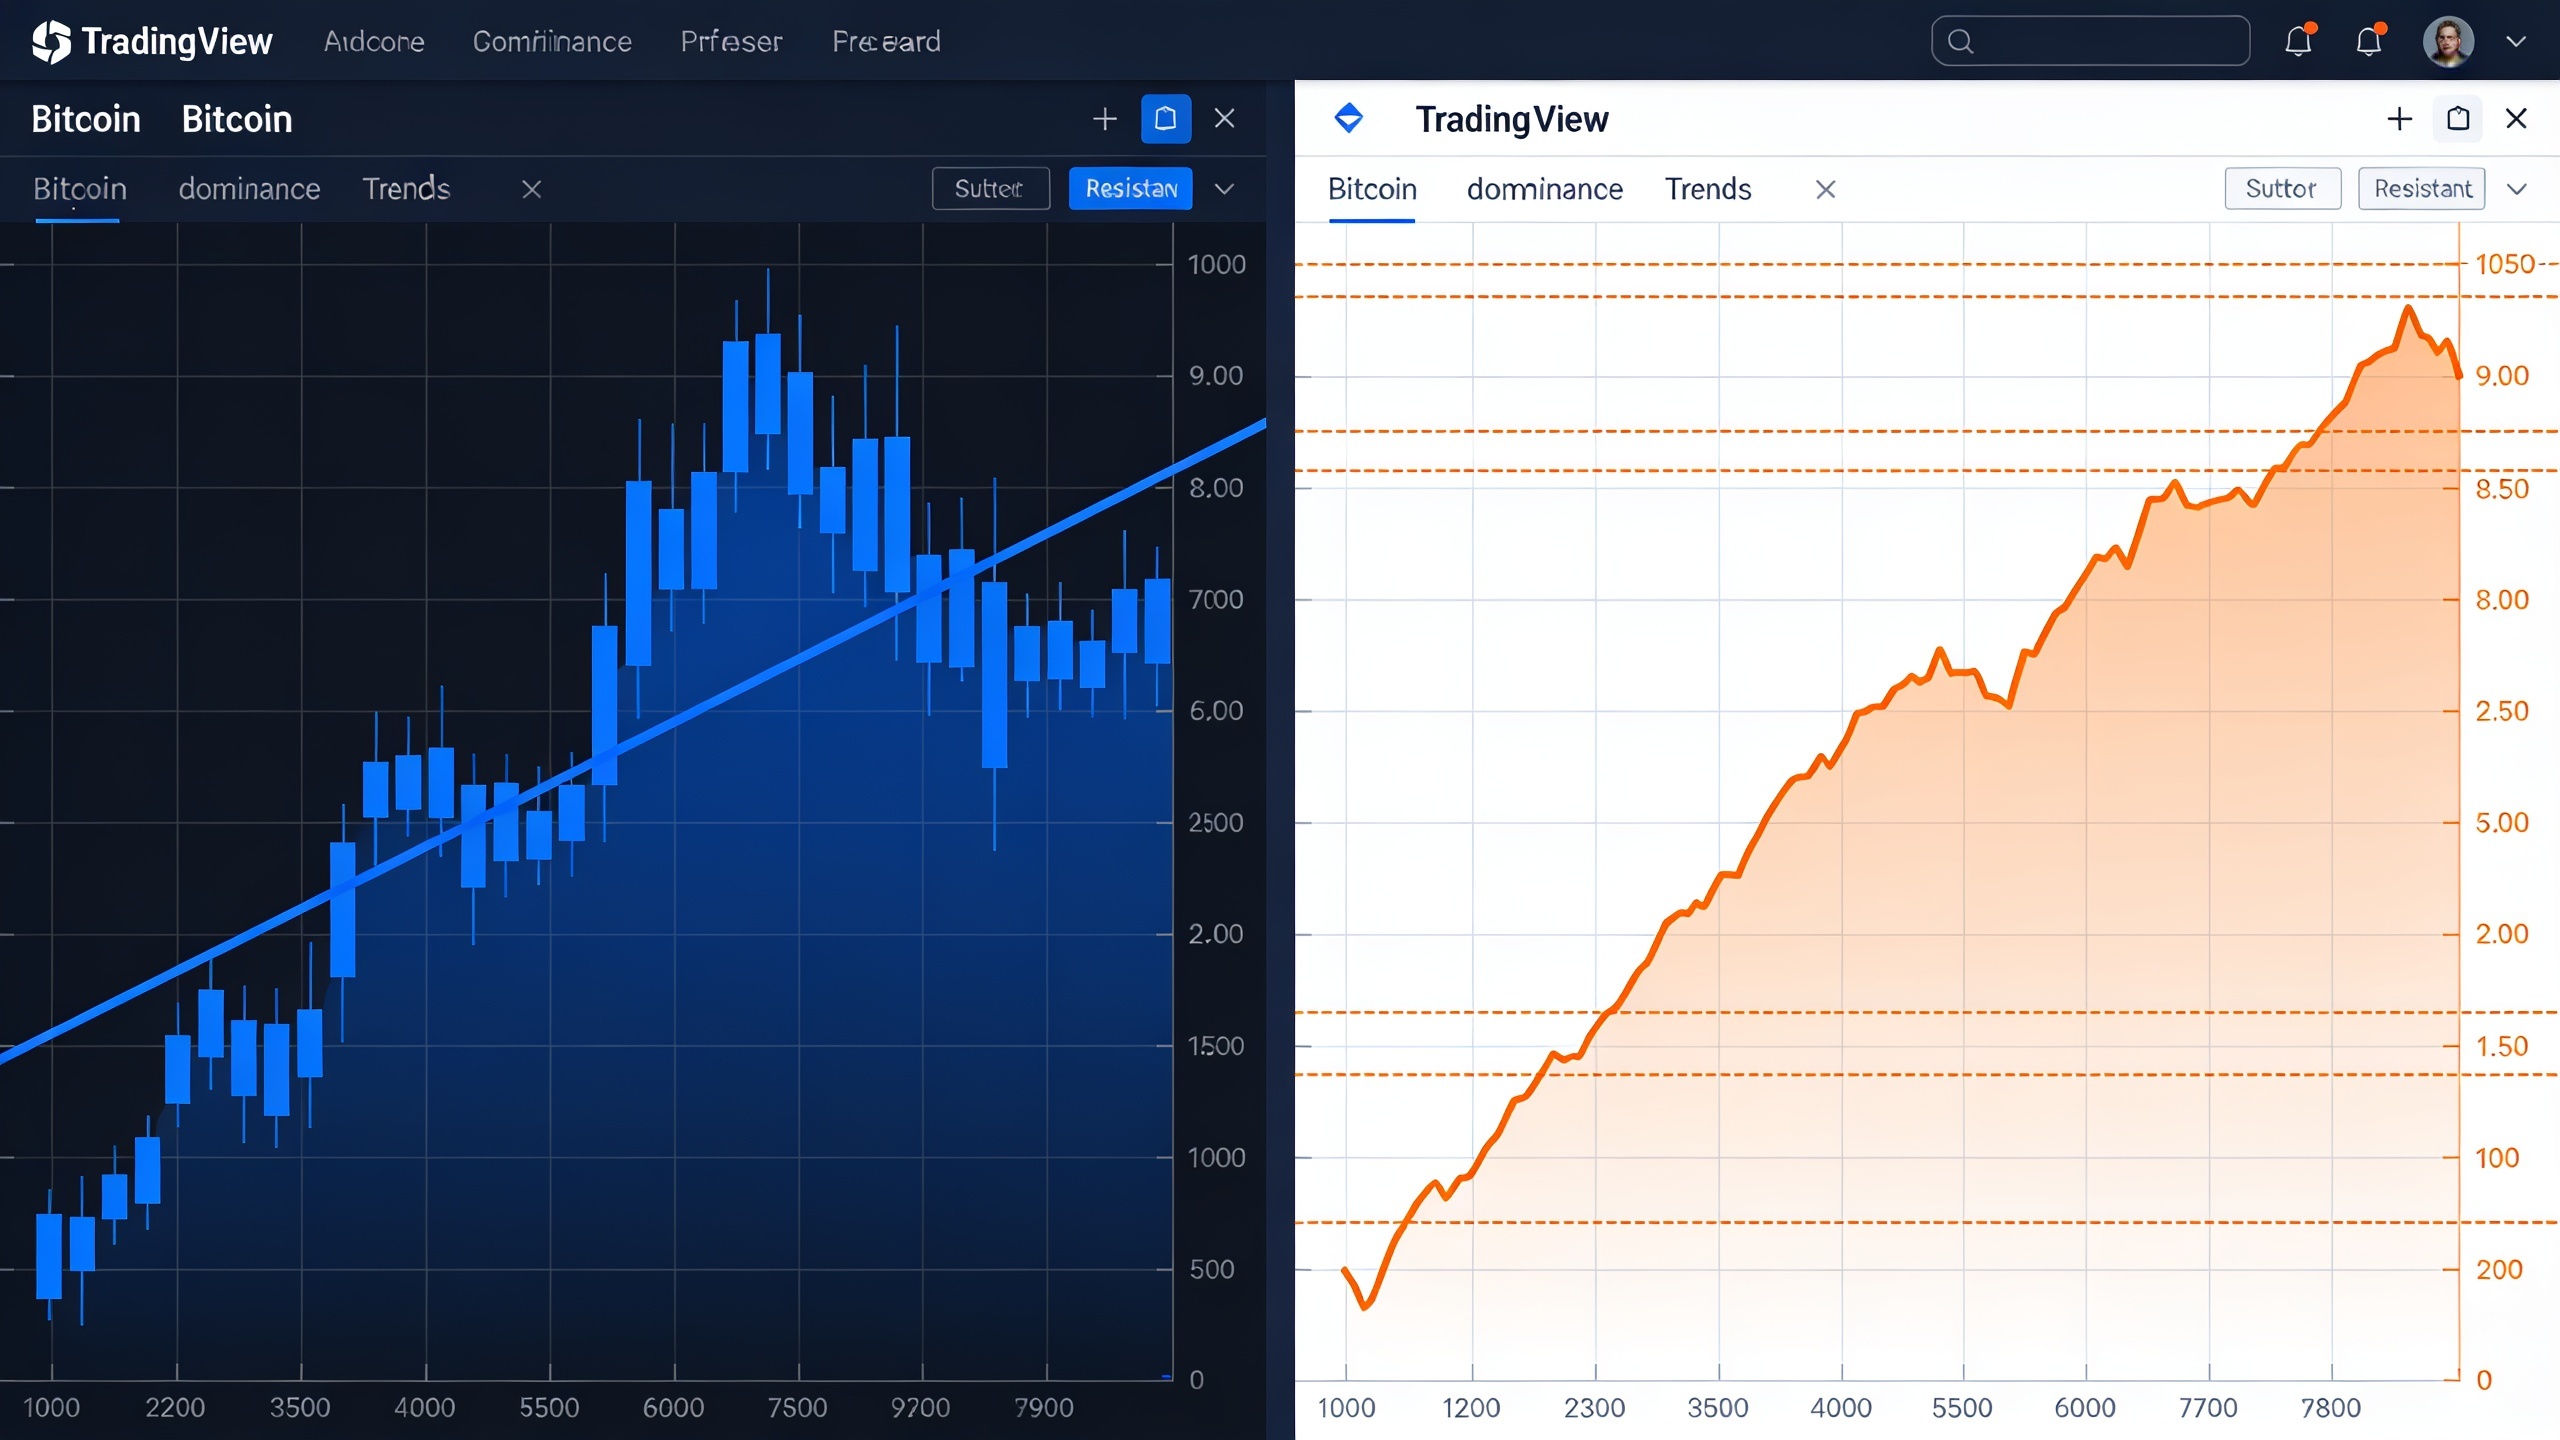
In practice, traders use it a few different ways. Some use it to confirm the market phase, checking whether dominance is trending up, down, or sideways over several weeks to frame whether the broader market currently favors Bitcoin or altcoins. Others use it to time rotation trades, waiting for dominance to break a key trendline or technical level before piling into alts, treating that breakdown as confirmation rather than a guess. And plenty use it for straight risk management, where a rising dominance trend while you're already holding altcoins works as an early warning to trim exposure or take profits on the weaker names in your bag.
It also helps to understand dominance in the context of the tools pros use to actually express these views, including leveraged instruments. If that side of the market is new to you, our guide on crypto derivatives, including futures, options, and perpetual swaps walks through how traders make directional bets on Bitcoin versus altcoins without necessarily holding the underlying coins. That's actually one reason dominance shifts can sometimes move faster than spot fundamentals alone would suggest.
Here's a simplified look at how the two broad dominance regimes tend to play out:
| Market Condition | Bitcoin Dominance Trend | Typical Altcoin Behavior | Common Trader Response |
|---|---|---|---|
| Risk-off / uncertainty | Rising | Underperform Bitcoin, often fall harder | Reduce altcoin exposure, favor Bitcoin or stablecoins |
| Early bull recovery | Rising to flat | Lag behind Bitcoin's initial move | Wait for confirmation before rotating |
| Broad altcoin season | Falling | Outperform Bitcoin across large-cap tokens | Rotate profits from Bitcoin into altcoins |
| Late-cycle speculation | Sharply falling | Small-cap and speculative tokens surge | Increase caution, watch for reversal signs |
Limitations of Bitcoin Dominance Explained
Bitcoin dominance has some genuine blind spots, and you really need to understand them before treating this thing as a standalone signal. The biggest one is that it's a market-cap-weighted average, which means a couple of huge altcoins (Ethereum especially, and sometimes the big stablecoin issuers) can distort the whole reading and completely mask what's actually happening across the broader alt market.
A few specific gaps worth burning into your memory. First, stablecoin distortion: because stablecoins get counted in "total crypto market cap" on most trackers, a big jump in stablecoin supply (money entering the market but just sitting in cash-equivalent form) can push dominance down without any real rotation into risk assets. That's exactly why some analysts prefer the stablecoin-excluded version for a cleaner signal.
Then there are new coin listings. When a fresh large-cap token launches and gets added to the trackers, it immediately shifts the total denominator in the calculation, creating a mechanical change in dominance that has nothing to do with actual trading. And here's the one I harp on the most: dominance is lagging, not leading. It reflects capital that already moved. By the time a clean trend shows up on the chart, a big chunk of the rotation has often already happened, which is the fair critique of using it as a precise entry signal instead of a broad confirmation tool.
Oh, and it gives you zero sector detail. Dominance can't tell you whether the money leaving Bitcoin is going into DeFi tokens, layer-1 chains, meme coins, or something else entirely. For that you need sector-specific market cap data. So because of all these gaps, most experienced traders treat dominance as one input among several, sitting alongside trading volume, on-chain data, and broader macro conditions, rather than a trigger they pull in isolation.
Worth remembering too that Bitcoin's role has evolved right alongside its tech. Infrastructure like the Lightning Network's faster, cheaper Bitcoin payment rails has stretched what Bitcoin can actually do beyond just being a store of value, which can subtly nudge long-term demand patterns that eventually show up in dominance data. The connection isn't immediate or direct, but it's there.
FAQ
What counts as a "high" Bitcoin dominance percentage?
There's no fixed line in the sand, since dominance has swung across an enormous range over the years. Instead of memorizing some magic number, most traders watch the direction and the speed of the change relative to recent history. A "high" reading in one cycle can look totally different from a "high" reading in another.
If Bitcoin dominance is falling, does that always mean altcoins are winning?
Nope. Dominance can fall simply because Bitcoin's price drops while altcoins fall by less, or hold steady, during a broad downturn. The ratio only tells you the relative share of market cap shifted. It does not confirm that altcoins are actually rising in dollar terms.
Can I use Bitcoin dominance to time altcoin season?
It's one of the most widely used tools for exactly that, and a sustained multi-week decline has historically coincided with broad altcoin outperformance. But it works best paired with something like an altcoin season index that tracks how many top alts are beating Bitcoin over a rolling period. Don't lean on it alone.
Why does Ethereum swing Bitcoin dominance around so much?
Because Ethereum is consistently one of the largest cryptos by market cap, big price moves in ETH can meaningfully drag the "total altcoin market cap" number used in the calculation, sometimes more than a whole pile of smaller altcoins combined.
Where can I actually check Bitcoin dominance in real time?
The big aggregators like CoinMarketCap and CoinGecko, plus charting platforms like TradingView, all publish live dominance charts that update continuously as prices and market caps move.
Final Thoughts
Bitcoin dominance is a dead-simple ratio with an outsized reputation, and using it well means looking past the headline percentage to figure out what's actually driving it: genuine rotation, stablecoin flows, or just Ethereum flexing its market cap. Used with a little care, alongside trading volume, sector performance, and broader market conditions, it's still one of the more accessible ways to gauge whether the market currently likes Bitcoin or the wider altcoin universe. But like any single metric, it earns its keep as part of a broader research process, not as a button you smash to buy or sell.