How to Predict Crypto Bull Run Trends Before the Rest of the Market Catches On
Every crypto cycle runs on the same script. Prices grind sideways for months, everyone gets bored and bitter, half your feed swears they're done with this stuff forever, and then almost overnight...

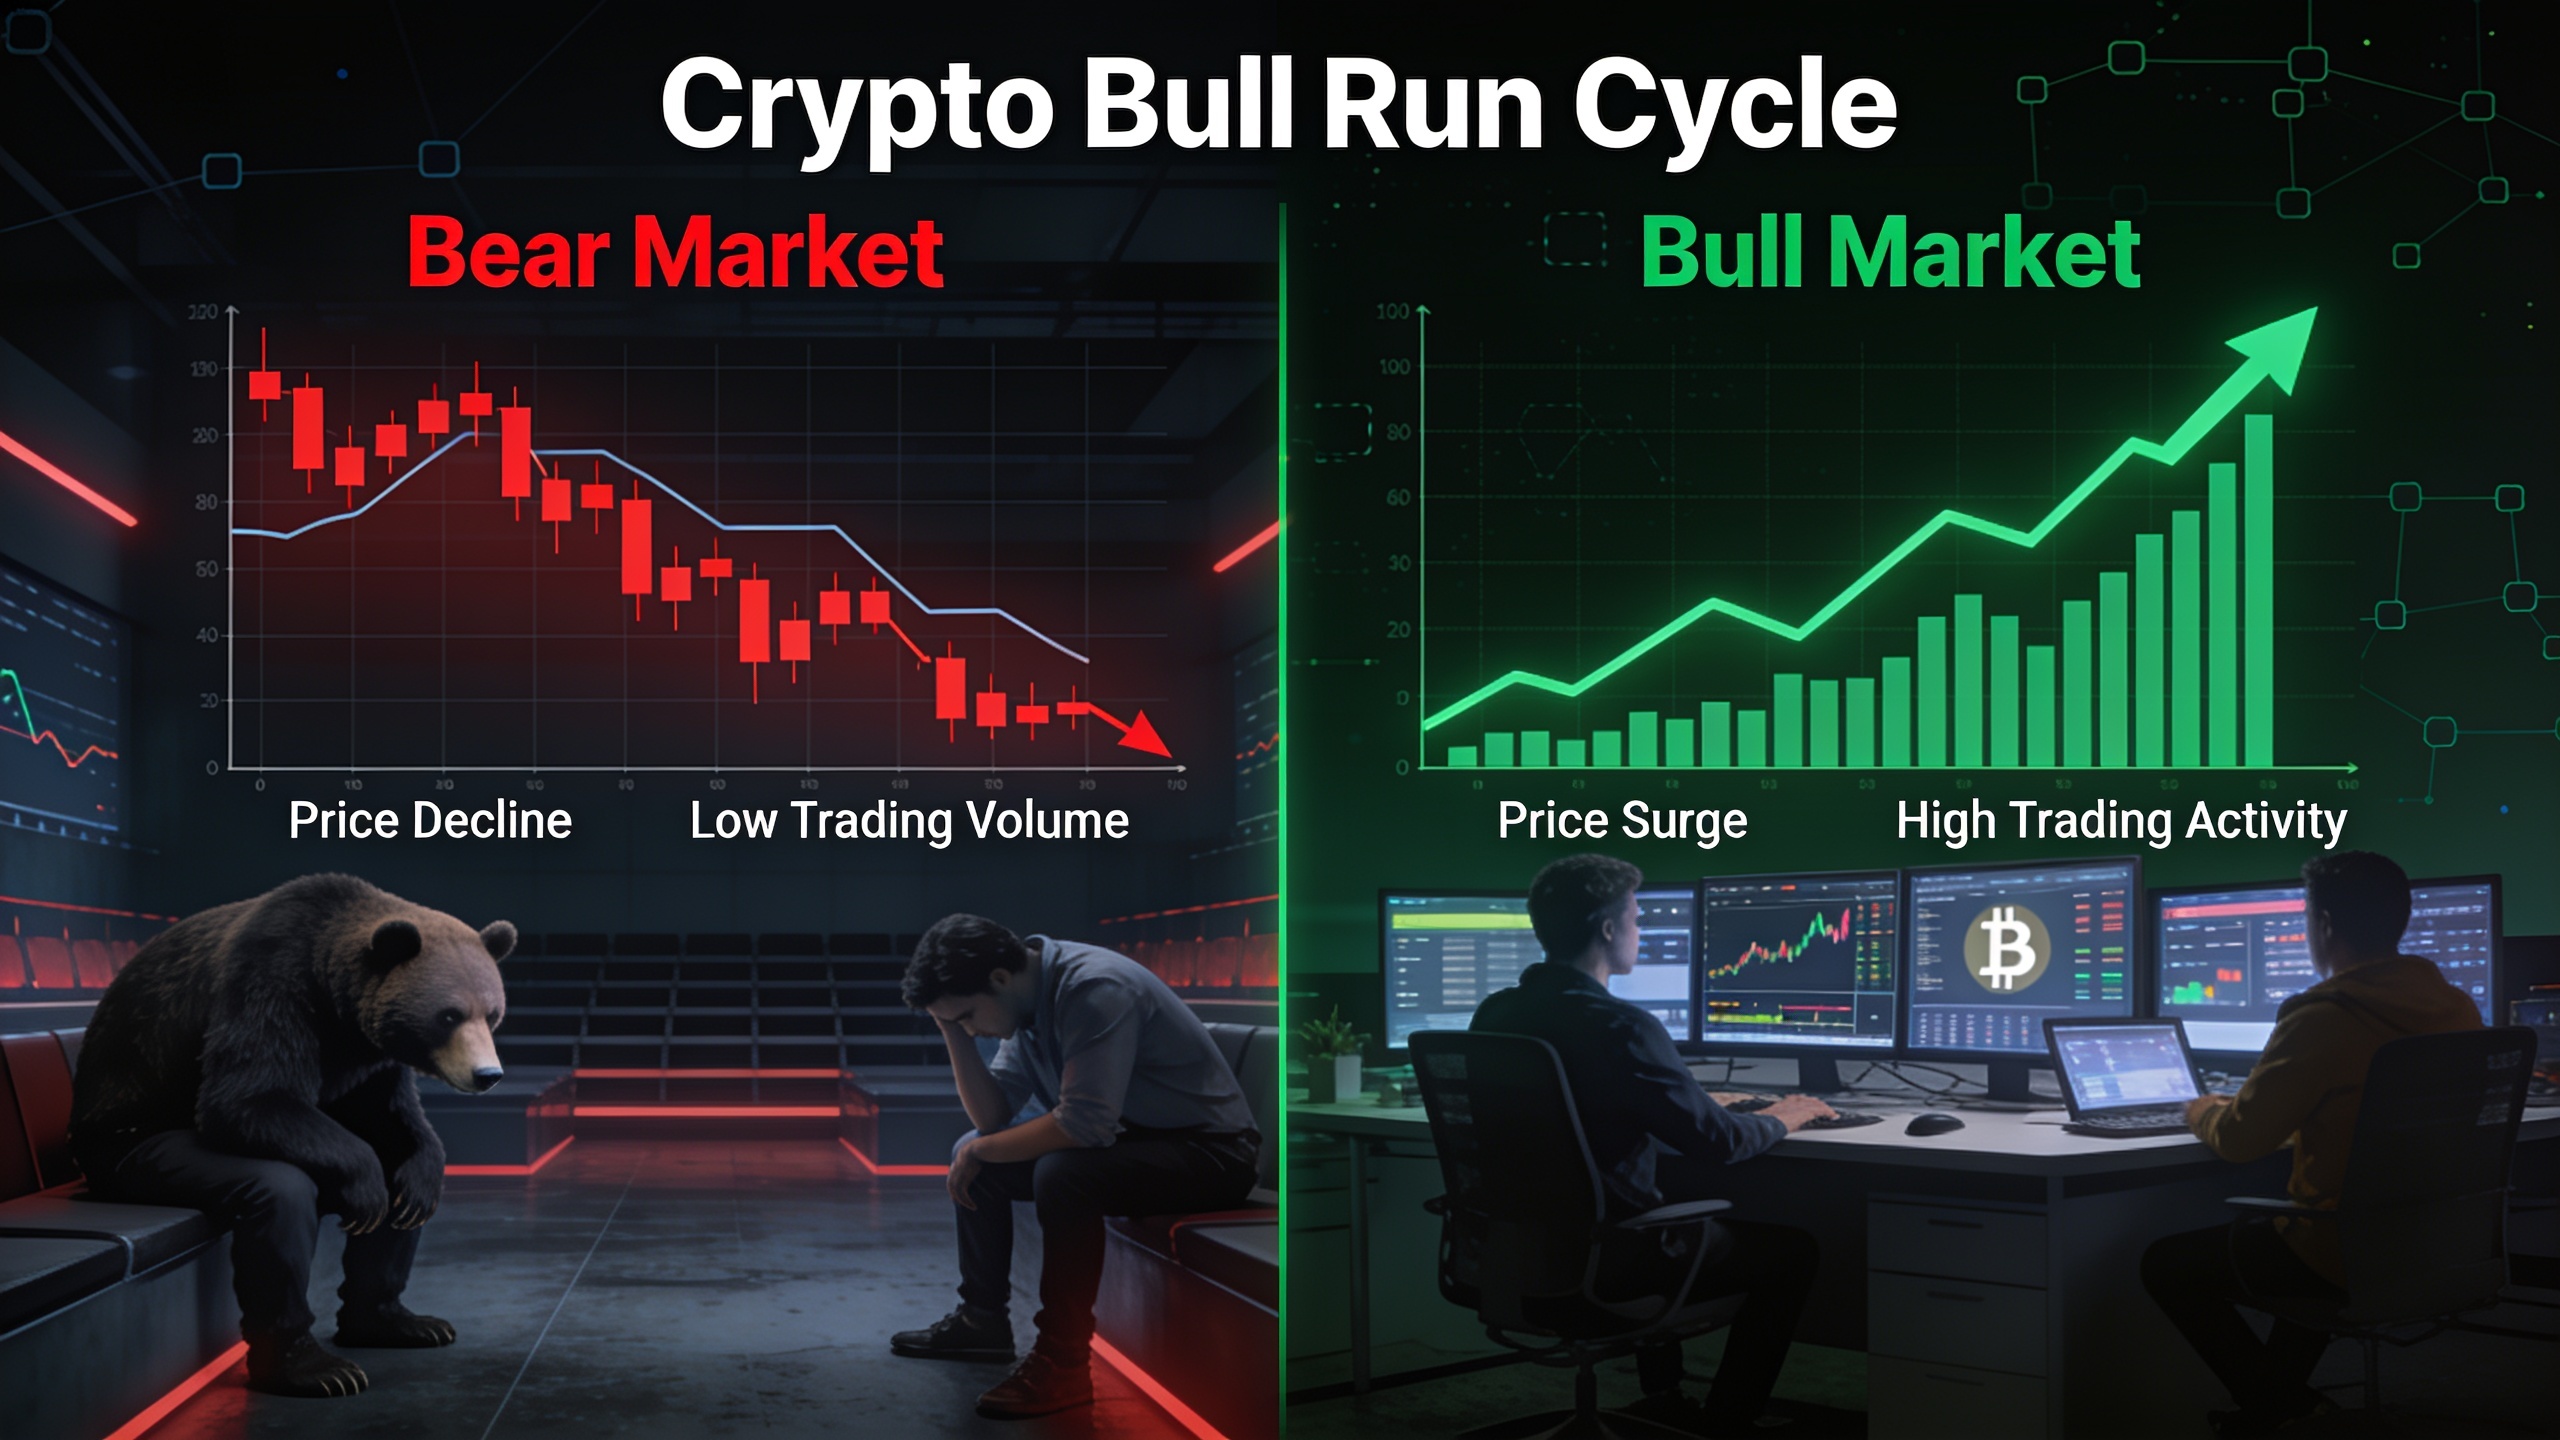
Every crypto cycle runs on the same script. Prices grind sideways for months, everyone gets bored and bitter, half your feed swears they're done with this stuff forever, and then almost overnight people are back to yelling about six-figure Bitcoin. If you've been around a few cycles, you've seen it. The trick to catching a bull run early has almost nothing to do with luck and everything to do with watching the right mix of on-chain data, macro conditions, and market indicators that tend to show up before the big moves. This is my attempt at laying out the actual signals that serious analysts and long-term holders watch, why they matter, and how to string them together into something repeatable instead of just vibes.
Table of Contents
- Why Predicting a Bull Run Actually Matters
- What Are Crypto Market Indicators and Why Do They Matter?
- How Can You Predict a Crypto Bull Run Using On-Chain Data?
- What Sentiment Analysis Reveals Before Prices Move
- Macro and Liquidity Signals That Precede Every Crypto Bull Run
- How to Predict a Crypto Bull Run Using Historical Cycle Patterns
- Comparing the Most Reliable Early Indicators
- Common Mistakes That Wreck Bull Run Predictions
- FAQ
Why Predicting a Bull Run Actually Matters
Catching a bull run early matters because the fattest percentage gains happen in the first third of the move, way before the mainstream news even notices. Look at Bitcoin's run from roughly $3,800 in March 2020 to over $69,000 in November 2021 (CoinMarketCap price data) and you'll see most of that multiple-expansion happened in the quieter, earlier months, not the frenzy at the end. By the time CNBC is running Bitcoin chyrons every hour, the easy money's gone.
And that's the whole problem with waiting for "confirmation." The people who buy once the financial news networks bless it are usually piling in during the euphoric middle-to-late stage, which is exactly when risk is highest and the upside left on the table is thinnest.
I want to be clear about something though. This isn't about nailing the exact bottom or the exact top. Nobody does that reliably, not even the pros with nine screens. It's about spotting a cluster of conditions that have historically shown up before big expansions, so you're positioned ahead of the crowd instead of chasing its taillights. If you want a sense of what a confirmed bull market looks like once it's already running, 5 signs of a crypto bull market you shouldn't ignore pairs nicely with this piece. The goal here is just to catch those same signs a few steps earlier, while they're still forming.
What Are Crypto Market Indicators and Why Do They Matter?
Crypto market indicators are the quantifiable data points, whether price-based, on-chain, or macroeconomic, that tell you something about the health, momentum, or positioning of the market. They matter because price by itself is a lagging signal. By the time the chart is screaming "uptrend," a big chunk of the move has usually already happened, and you're the one showing up late to the party.
Analysts tend to lump these indicators into four buckets. Technical stuff (moving averages, RSI, volume trends), on-chain (wallet activity, exchange flows, miner behavior), sentiment (social chatter, search trends, fear/greed readings), and macro (interest rates, dollar strength, liquidity). None of these works well alone. A rising Fear & Greed reading, for instance, tells you almost nothing on its own without on-chain accumulation data backing it up. The setups worth trusting are the ones where multiple categories point the same direction at the same time. Traders call this "confluence," and honestly it's the single most important concept in this whole article.

One more thing worth flagging. Institutional money has genuinely changed how some of these indicators behave. As how institutional investors are reshaping the crypto market gets into, the arrival of asset managers, ETFs, and corporate treasuries since 2024 has handed us entirely new data sources (spot Bitcoin ETF flows being the big one) that simply didn't exist in earlier cycles. That's now another layer of confirmation you can lean on.
How Can You Predict a Crypto Bull Run Using On-Chain Data?
On-chain data is the stuff recorded straight onto a blockchain's public ledger: wallet balances, transaction volumes, exchange deposits and withdrawals, miner and validator activity. It's one of the most reliable ways to read an early bull run because it shows you what the big holders are actually doing, not what they're tweeting.
Exchange Flows and Whale Accumulation
When large amounts of Bitcoin or Ethereum move off exchanges and into private wallets, that usually means holders are settling in for the long haul rather than getting ready to dump. Firms like Glassnode and CryptoQuant track this obsessively, and sustained outflow trends have preceded major rallies before, including the buildup to the 2020-2021 cycle. The reverse is also true: big inflows to exchanges, especially from wallets tagged as "whales," often come right before sell-offs or long boring consolidation phases.
Miner and Validator Behavior
Bitcoin miners have historically sold off part of their stack to pay the bills. So when they stop selling and start holding, which you can see through metrics like the Miner Position Index, it's a quiet vote of confidence in higher prices ahead. On the Ethereum side, rising validator counts and staking deposits after the 2022 Merge have played a similar role, acting as a proxy for conviction among the more sophisticated crowd.
Active Addresses and Network Growth
A steady climb in active wallet addresses and brand-new addresses being created tends to lead price gains, because it reflects real people using the network rather than bots churning speculative volume. It's a bit like how any well-run operation needs clean, organized data underneath it to actually function. In the same way a platform like Medinex pulls workforce and compliance data into a single dashboard for disability support providers, on-chain analytics tools pull messy blockchain data into something digestible, so you can spot accumulation without hand-parsing raw ledger entries at 2am.
Stablecoin Supply Ratio
The stablecoin supply ratio (SSR) stacks Bitcoin's market cap against the total supply of stablecoins floating around. When the SSR falls, it means there's a big pile of "dry powder," basically stablecoin liquidity sitting on the sidelines, relative to Bitcoin's cap. That's fuel. Once sentiment turns, that money has to go somewhere. A rising stablecoin supply, particularly over on Tron and Ethereum, has often shown up before renewed risk appetite in past cycles.
What Sentiment Analysis Reveals Before Prices Move
Sentiment analysis takes the collective mood of the market (social media, search trends, dedicated indices) and tries to measure it, and it tends to hit extremes at both bottoms and tops well before price confirms anything. The old contrarian principle applies: peak pessimism usually marks accumulation zones, peak euphoria usually marks distribution zones. Be greedy when others are fearful, and all that.
The Crypto Fear & Greed Index
Alternative.me's Crypto Fear & Greed Index blends volatility, momentum, social sentiment, dominance, and search trends into one number from 0 (extreme fear) to 100 (extreme greed). Prolonged readings under 20 have lined up with cycle bottoms before, most memorably in late 2022 after the FTX blowup, when Bitcoin was scraping around $16,000. Spotting a reading that extreme, and not panicking along with the headlines, is honestly the first practical skill you need if you want to see a bull run coming before the mood shifts.
Search and Social Volume
Google Trends for stuff like "buy Bitcoin" or "crypto crash" makes a decent rough sentiment gauge. Here's the counterintuitive bit: searches for "buy Bitcoin" usually spike near local tops when retail FOMO is at full blast. Genuine early-cycle accumulation, on the other hand, tends to be marked by low search volume even as prices creep up. That divergence, quiet search plus rising price, is one of my favorite things to watch.
Developer and Community Activity
Sentiment isn't only about price chatter, either. Steady growth in GitHub commits, developer activity, and real community engagement around an ecosystem often shows up before investor interest returns, because builders tend to lead price discovery by months. It's the same discipline you see in totally unrelated fields where consistent prep beats last-minute cramming. Kind of like how a resource such as Quiethelpgcse helps students build steady study habits ahead of exams instead of panicking the night before, the investors who do well build their monitoring habits before the bull run is obvious, not scrambling to catch up once it's already going.
Macro and Liquidity Signals That Precede Every Crypto Bull Run
Crypto doesn't move in a vacuum anymore, so if you're serious about predicting a bull run you have to watch the macro picture alongside the crypto-specific stuff. Since 2020 Bitcoin's correlation with risk assets like the Nasdaq 100 has gotten a lot tighter, which makes interest rate policy and dollar liquidity two of the biggest external levers on the whole thing.
Federal Reserve Policy and Interest Rates
Crypto bull markets have historically found their legs during periods of easing money or expected rate cuts, when investors start rotating cash into riskier, higher-reward bets. The 2020-2021 run happened right alongside near-zero rates and heavy quantitative easing from the Fed. And then the flip side proved the point: the aggressive rate hikes all through 2022 lined up almost perfectly with the broad crypto crash (per Federal Reserve policy records). Cheap money good, expensive money bad. Roughly.
Global M2 Money Supply
Global M2 money supply (a broad measure of cash, checking deposits, and easily convertible near-money across major economies) has shown a noticeable lagged relationship with Bitcoin's price across multiple cycles. When global liquidity expands, capital tends to slosh into speculative assets on a delay of roughly 10-12 weeks, based on analysis macro-focused crypto researchers cite constantly. Keeping an eye on M2 trends across the US, China, and the Eurozone gives you an early read on whether the environment is tilting toward a risk-on rotation. It's not precise, but it's directional, and directional is useful.
ETF and Institutional Flows
Ever since spot Bitcoin ETFs got approved in the US in January 2024, the daily net inflow and outflow numbers from products like BlackRock's IBIT have become a near real-time read on institutional demand. Multi-week inflow streaks have tended to show up with strengthening price trends, while outflow streaks have often come right before consolidation or pullbacks. This is genuinely new information we just didn't have last cycle.
How to Predict a Crypto Bull Run Using Historical Cycle Patterns
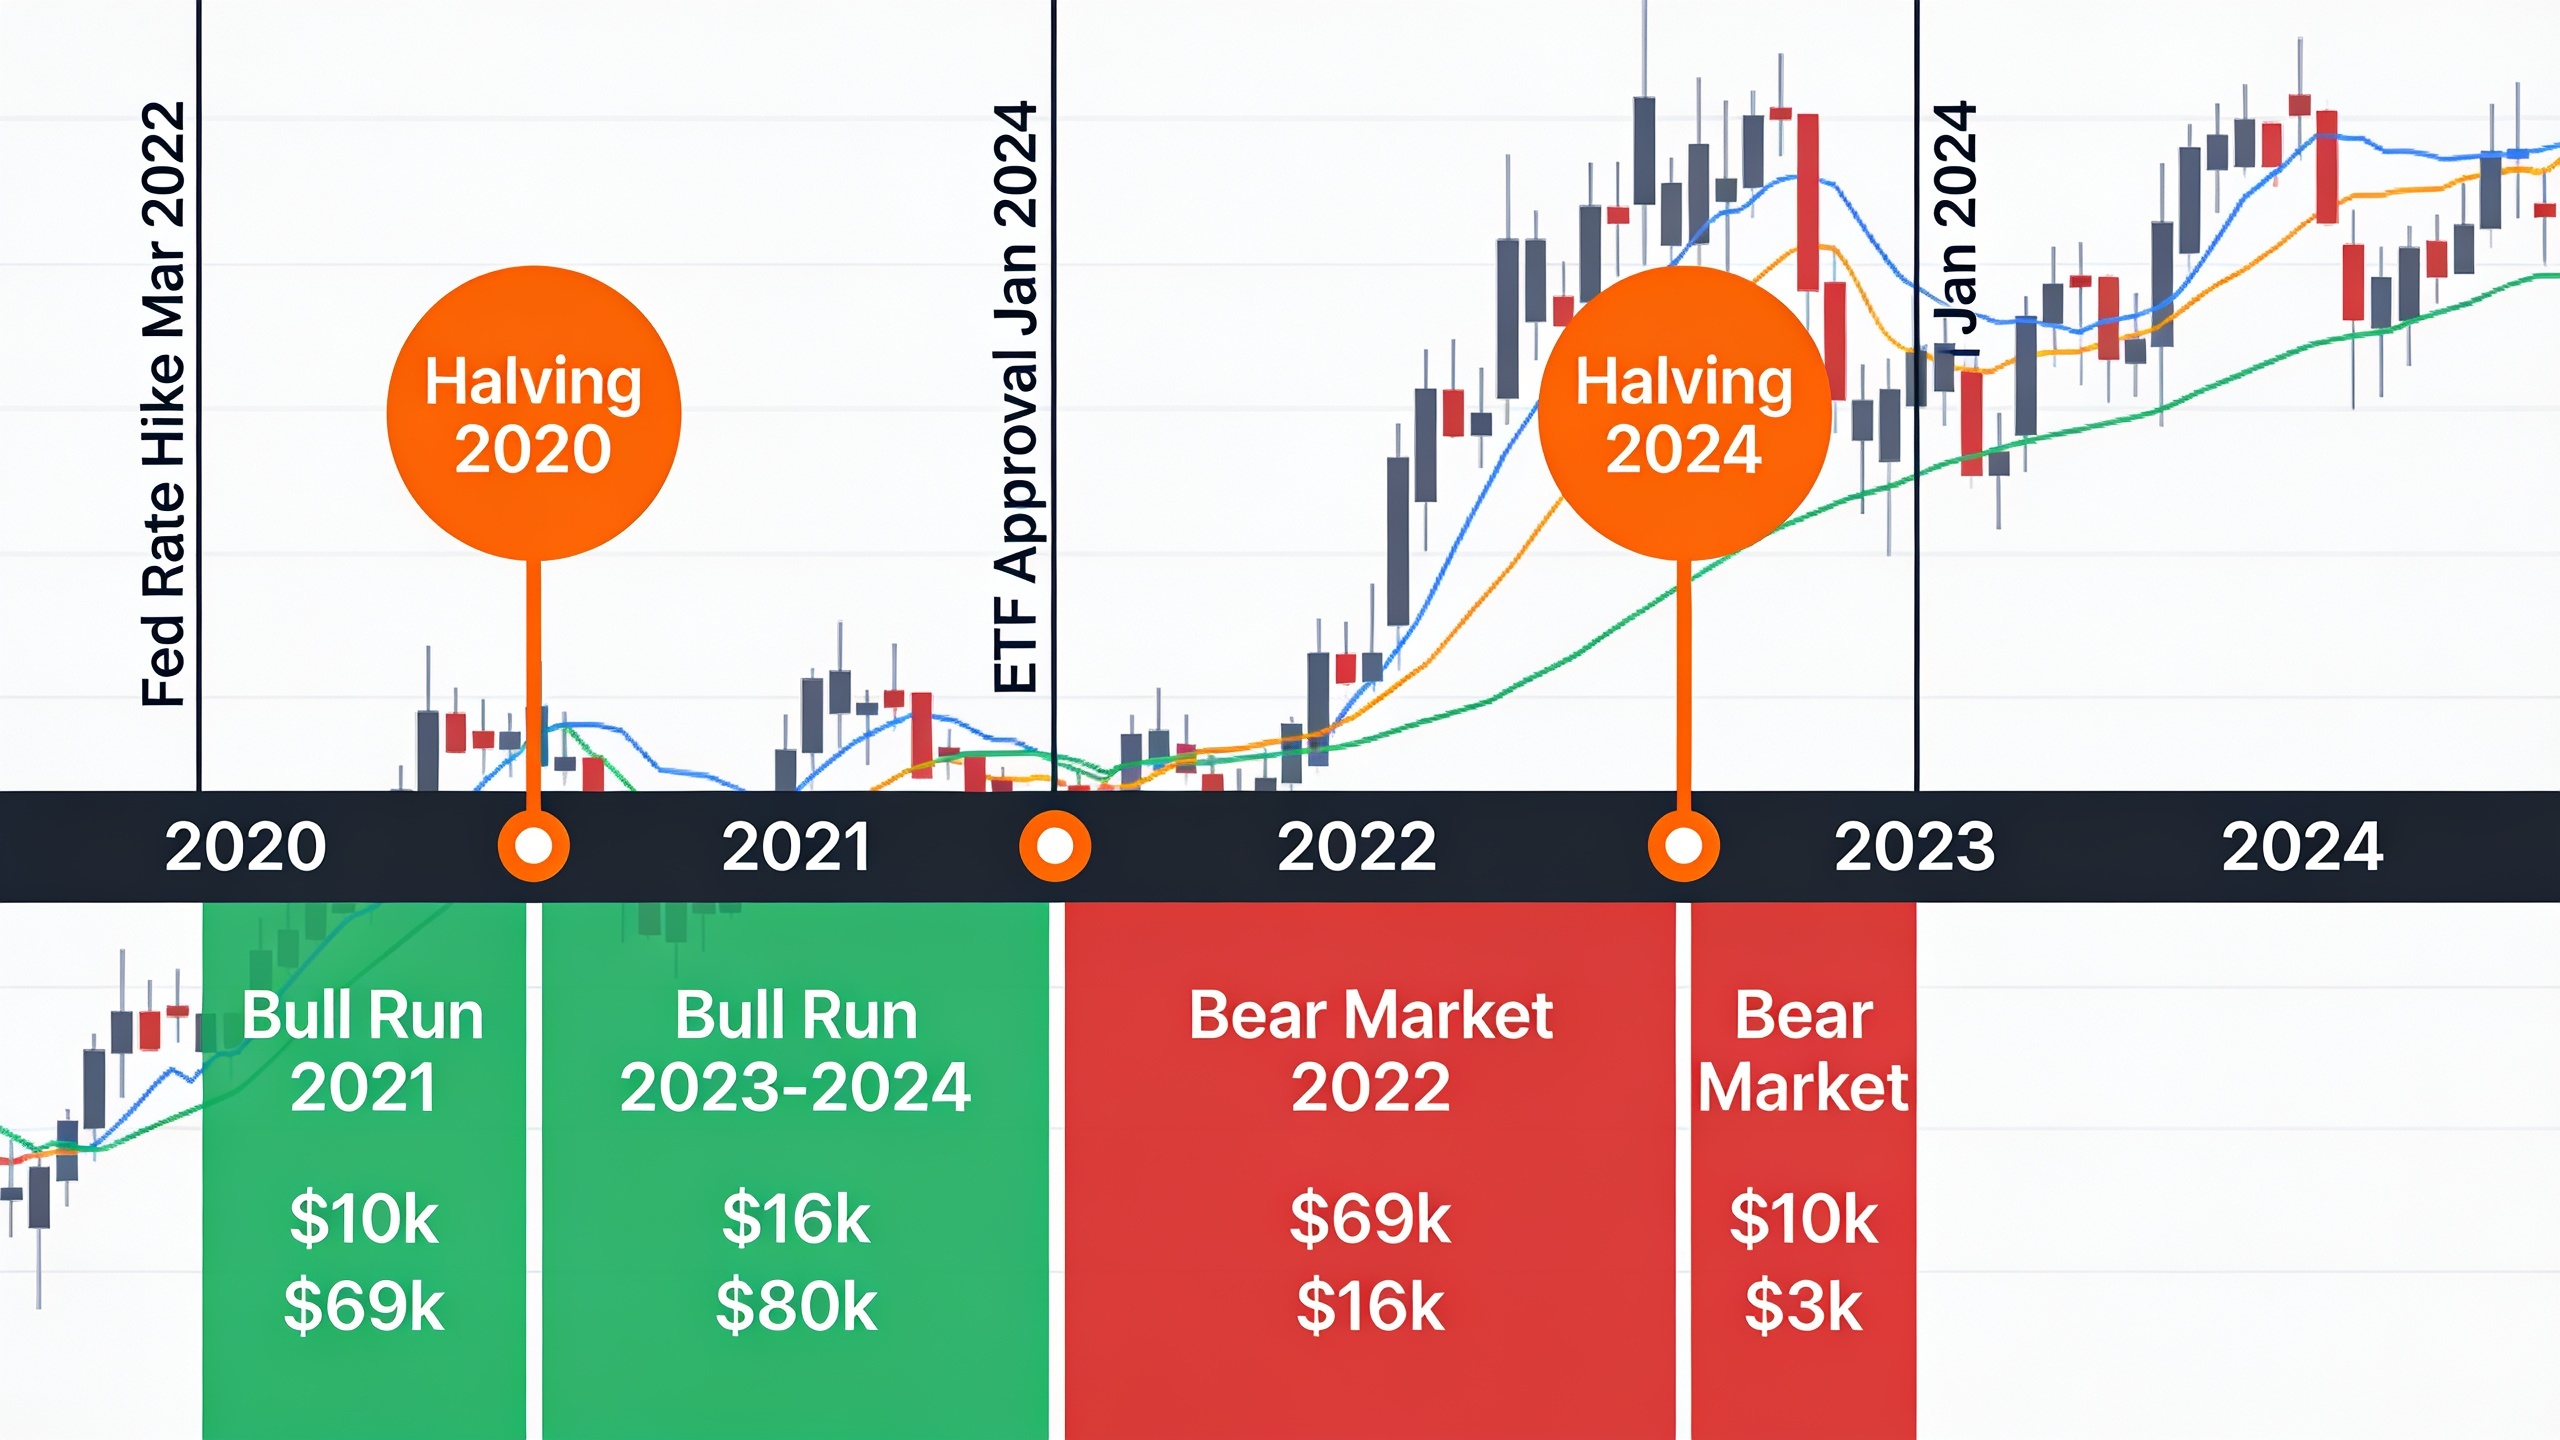
Bitcoin has historically run in roughly four-year cycles tied to its halving events, and studying those patterns is still one of the more structured ways to guess at a bull run's timing, even though past performance guarantees nothing. Quick refresher: a halving is a pre-programmed event that chops Bitcoin's block reward, and therefore its new supply, in half about every four years.
After all three previous halvings (2012, 2016, 2020), Bitcoin ran into a major bull market within 12-18 months, according to historical price data compiled by a bunch of blockchain research firms. The latest one landed in April 2024, cutting the block reward from 6.25 BTC to 3.125 BTC. If precedent holds, the biggest appreciation windows tend to crack open in the months after a supply shock like that, though macro can absolutely speed it up or drag it out.
| Cycle Indicator | What It Measures | Historical Reliability | Typical Lead Time Before Bull Run |
|---|---|---|---|
| Exchange net outflows | Whale/long-term holder accumulation | High | 3-6 months |
| Stablecoin supply ratio (SSR) | Available buying power on sidelines | Moderate-High | 2-4 months |
| Fear & Greed Index (extreme fear) | Retail capitulation/contrarian bottom | Moderate | 1-3 months |
| Bitcoin halving cycle | Supply issuance reduction | High (3 of 3 prior cycles) | 6-18 months |
| Global M2 money supply growth | Macro liquidity conditions | Moderate | 2-3 months (lagged) |
| Spot ETF net inflows | Institutional demand | Emerging, limited history | Real-time to 1 month |
Not one row in that table works reliably on its own, and those reliability estimates come from watching historical patterns, not some guaranteed crystal ball. The strong signal is confluence, again. Exchange outflows climbing at the same moment the Fear & Greed Index sits deep in "extreme fear," with monetary policy easing in the background. When three unrelated things start pointing the same way, that's when I start paying real attention.
Common Mistakes That Wreck Bull Run Predictions
The number one mistake people make is leaning on a single indicator, usually price action or social hype, instead of cross-checking a few independent data sources. Price is a lagging output of the market, not a leading input. React to price alone and you've basically pre-ordered a late entry.
Second big one: ignoring risk management while you position ahead of a suspected run. These signals are probabilistic, not prophecies, so how you size positions and what your plan is for being wrong matters just as much as the analysis. It's a bit like why families bringing parents or grandparents to Canada under the Super Visa program still lock in coverage like Super Visa Insurance Calgary even when the trip looks totally routine on paper. Good planning accounts for the version of events where things don't go as expected, and your crypto positioning deserves the exact same respect.
Third, information overload with no system to tame it. There are dozens of on-chain dashboards, sentiment trackers, and macro releases you could be watching, and investors without a repeatable checklist tend to just react to whatever headline is loudest that morning. Automation helps here, same as it does in totally unrelated fields. Think about how RobinRank automates SEO content research and publishing so teams can focus on strategy instead of grinding through manual repetition. The smart crypto investors do something similar with their own data-gathering, whether that's indicator dashboards, price alerts, or a scheduled weekly review, rather than trying to hold everything in their head in real time.
And finally, people constantly mistake a relief rally for the real thing. Bear markets are riddled with 20-30% "bear market rallies" that snap right back down and trap everyone who FOMO'd in. Waiting for confluence across on-chain, sentiment, and macro, instead of getting excited about one big green candle, is how you filter most of those fakeouts out.
FAQ
So what's the single best indicator for predicting a bull run?
There isn't one, sorry. Ask any decent analyst and they'll point you toward confluence: combining on-chain accumulation (like exchange outflows), sentiment extremes (like a stubborn "extreme fear" reading), and macro liquidity trends. Each category throws off false signals on its own, so the answer is always "watch several at once."
How early can on-chain data actually call a bull run?
Historically, sustained exchange outflows and falling stablecoin supply ratios have appeared 2-6 months ahead of major rallies in past cycles, based on data from platforms like Glassnode and CryptoQuant. That said, the exact lead time bounces around cycle to cycle, so don't treat it as a countdown timer.
Does the Bitcoin halving guarantee a bull run?
No. All three prior halvings (2012, 2016, 2020) were followed by big bull runs within roughly 12-18 months, but each one happened under different macro conditions, and past patterns aren't a promise, especially as the market matures and more institutional money floods in.
How do institutional investors change these signals?
They've handed us new, more transparent data points, like daily spot Bitcoin ETF inflow and outflow figures, that just weren't around in earlier cycles. That's made it a bit easier to read large-scale demand in real time. There's a fuller breakdown in the article on institutional investors reshaping crypto markets.
Can I time my entries on sentiment analysis alone?
Nope. Extreme fear or greed readings work best as contrarian confirmation alongside on-chain and macro data, not as a standalone timing tool. Sentiment can stay pinned at an extreme way longer than you'd think during a nasty bear market or a raging euphoric top.
Spotting a bull run before it's obvious isn't about unearthing some secret indicator nobody else has. It's about consistently tracking a small handful of proven on-chain, sentiment, and macro signals, noticing when they line up, and having the nerve to act while things still look uncertain to everyone else. All the tools and data are public and mostly free. What actually separates the early buyers from the late chasers is just the boring habit of checking them regularly and reading them together instead of one at a time.